NLU Course — Assignment 1

Sports vs Politics
Text Classification

A systematic comparative study of classical machine learning techniques for binary document classification, evaluating five feature extraction strategies across five classifiers on a multi-source news corpus.

Priyadip Sau · M25CSA023 25 Experimental Configs Best Accuracy: 91.46%
0
Documents
0
Configurations
0
Best Accuracy
0
Classifiers

What This Project Does

We tackle the binary classification problem of distinguishing sports articles from political coverage—not because the task is intrinsically hard, but because the simplicity of the label space lets us rigorously isolate how different feature representations interact with different classifier architectures. The pipeline spans everything from multi-source data ingestion and NLTK-driven preprocessing to systematic evaluation across 25 experimental configurations.

📰

Multi-Source Corpus

BBC News Archive, template-driven synthetic generation, and real-time Indian news via NewsAPI—three data streams blended to ensure diversity in writing style, temporal coverage, and geographic focus.

🔬

5 × 5 Evaluation Grid

Five feature extraction methods (BoW and TF-IDF with varying n-gram ranges) crossed with five classifiers (NB, LR, SVM, RF, GB), yielding 25 configurations evaluated on six metrics each.

📊

Rich Visualization Suite

Publication-quality figures—heatmaps, radar charts, confusion matrices, cross-validation error bars—generated automatically by a dedicated ExperimentVisualizer class at 300 DPI.

Data Collection Pipeline

The corpus assembles real editorial content, controlled synthetic data, and live API-fetched news articles into a single cohesive dataset for classification.

📁
BBC News Archive
Kaggle · 2004–2005 · sport & politics
🤖
Synthetic Generator
1,000 template-based articles
🌐
NewsAPI (India)
Cricket, football, parliament, elections
Final Dataset
~6,440 documents · 2 classes
🧹

Preprocessing

Lowercasing, URL/email removal, punctuation stripping, NLTK tokenization, English stopword removal, and WordNet lemmatization—applied uniformly to every document before vectorization.

📐

Feature Extraction

CountVectorizer (BoW) and TfidfVectorizer with sublinear TF scaling, max_features=5000, min_df=2, max_df=0.95. Evaluated at unigram, bigram, and trigram configurations.

⚖️

Train-Test Split

80/20 stratified split (random_state=42) preserving class proportions. 5-fold stratified cross-validation on the training set to assess generalization stability.

Machine Learning Techniques

Five classifiers spanning probabilistic, linear, and ensemble paradigms—each evaluated across all five feature representations.

🎲

Multinomial Naive Bayes

Probabilistic baseline assuming feature independence. Blatantly violates linguistic reality, yet rarely harms classification performance on text. Fast to train, interpretable.

📈

Logistic Regression

L2-regularized linear model (max_iter=1000). Outputs calibrated probabilities via the sigmoid function. A formidable competitor in high-dimensional sparse settings.

🔲

Support Vector Machine

Linear-kernel SVM maximizing the margin between class boundaries. Probability estimates enabled via Platt scaling. Long track record of excellence on text classification.

🌲

Random Forest

Ensemble of 100 bootstrapped decision trees. Captures non-linear interactions and provides feature importance, but tends to underperform linear models on sparse text features.

🚀

Gradient Boosting

Sequential ensemble of 100 boosted trees correcting residual errors. Dominates tabular benchmarks, but struggles with the extreme sparsity of text vectorizations.

Tech Stack

🐍 Python 3.8+ 🔢 NumPy 🐼 Pandas ⚙️ scikit-learn 📝 NLTK 📊 Matplotlib 🎨 Seaborn 🌐 NewsAPI

Experimental Results

Complete metrics for all 25 configurations. Click column headers to sort. Toggle between metrics using the buttons below.

# Feature Method Classifier Accuracy F1 Score Precision Recall CV Mean ROC-AUC

Experimental Plots

Publication-quality figures generated at 300 DPI. Click any image to expand.
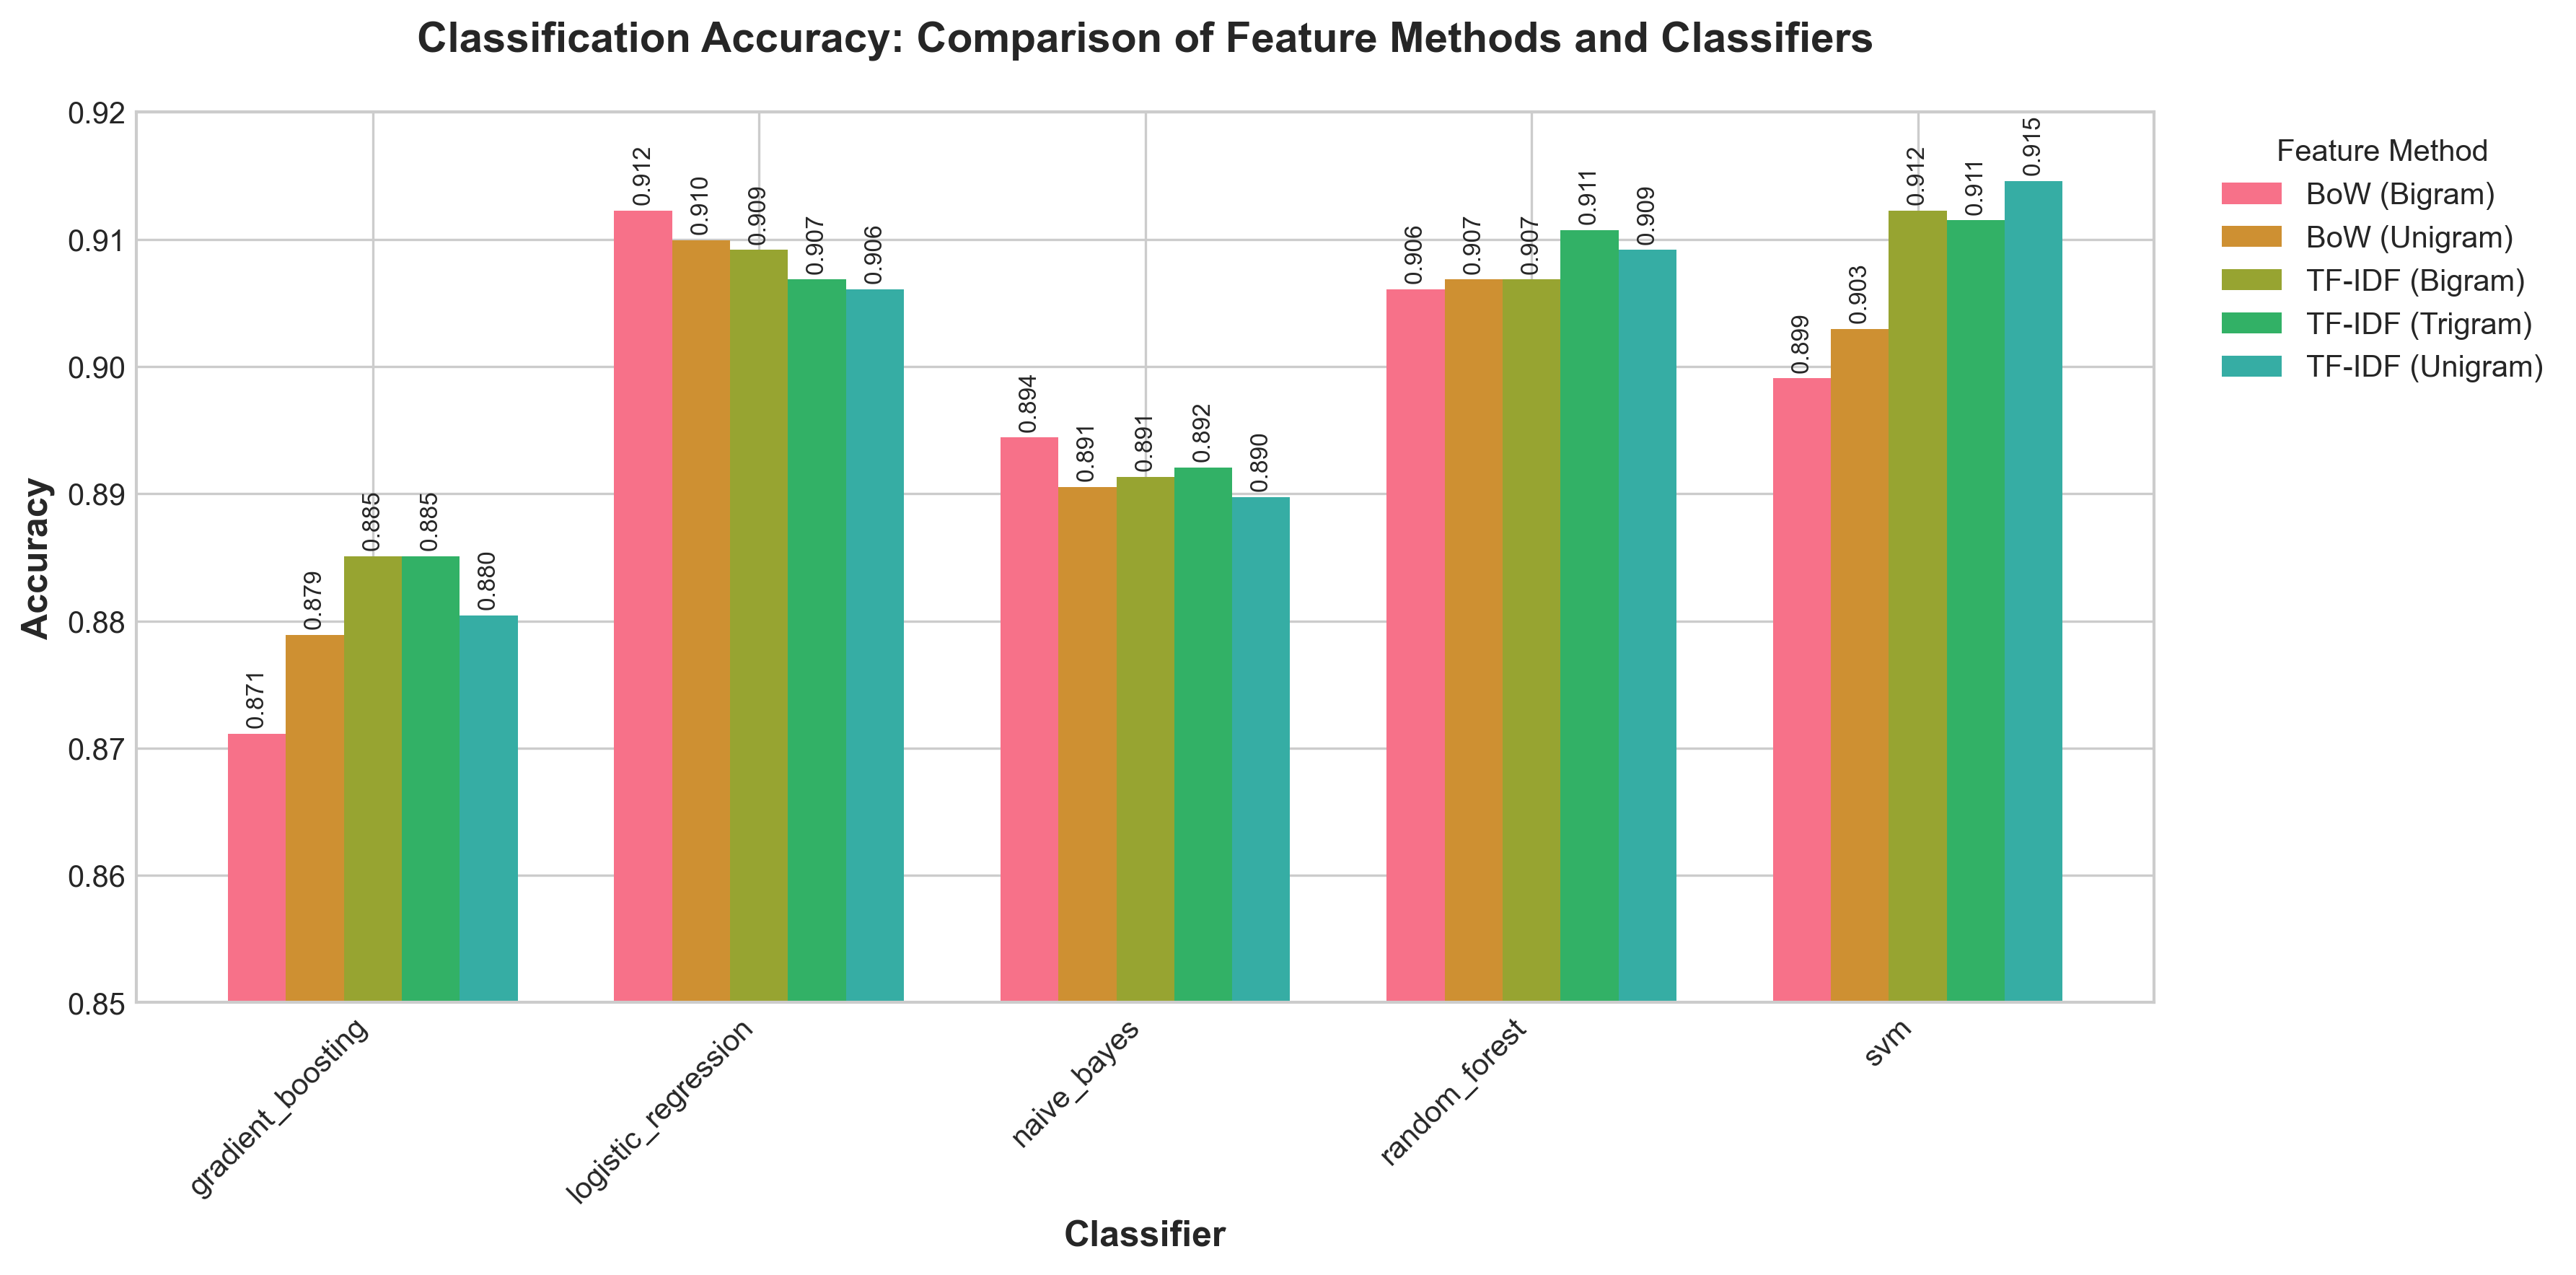
Accuracy Comparison

Accuracy Comparison

Grouped bar chart of classification accuracy across all feature methods and classifiers, with values annotated on each bar.
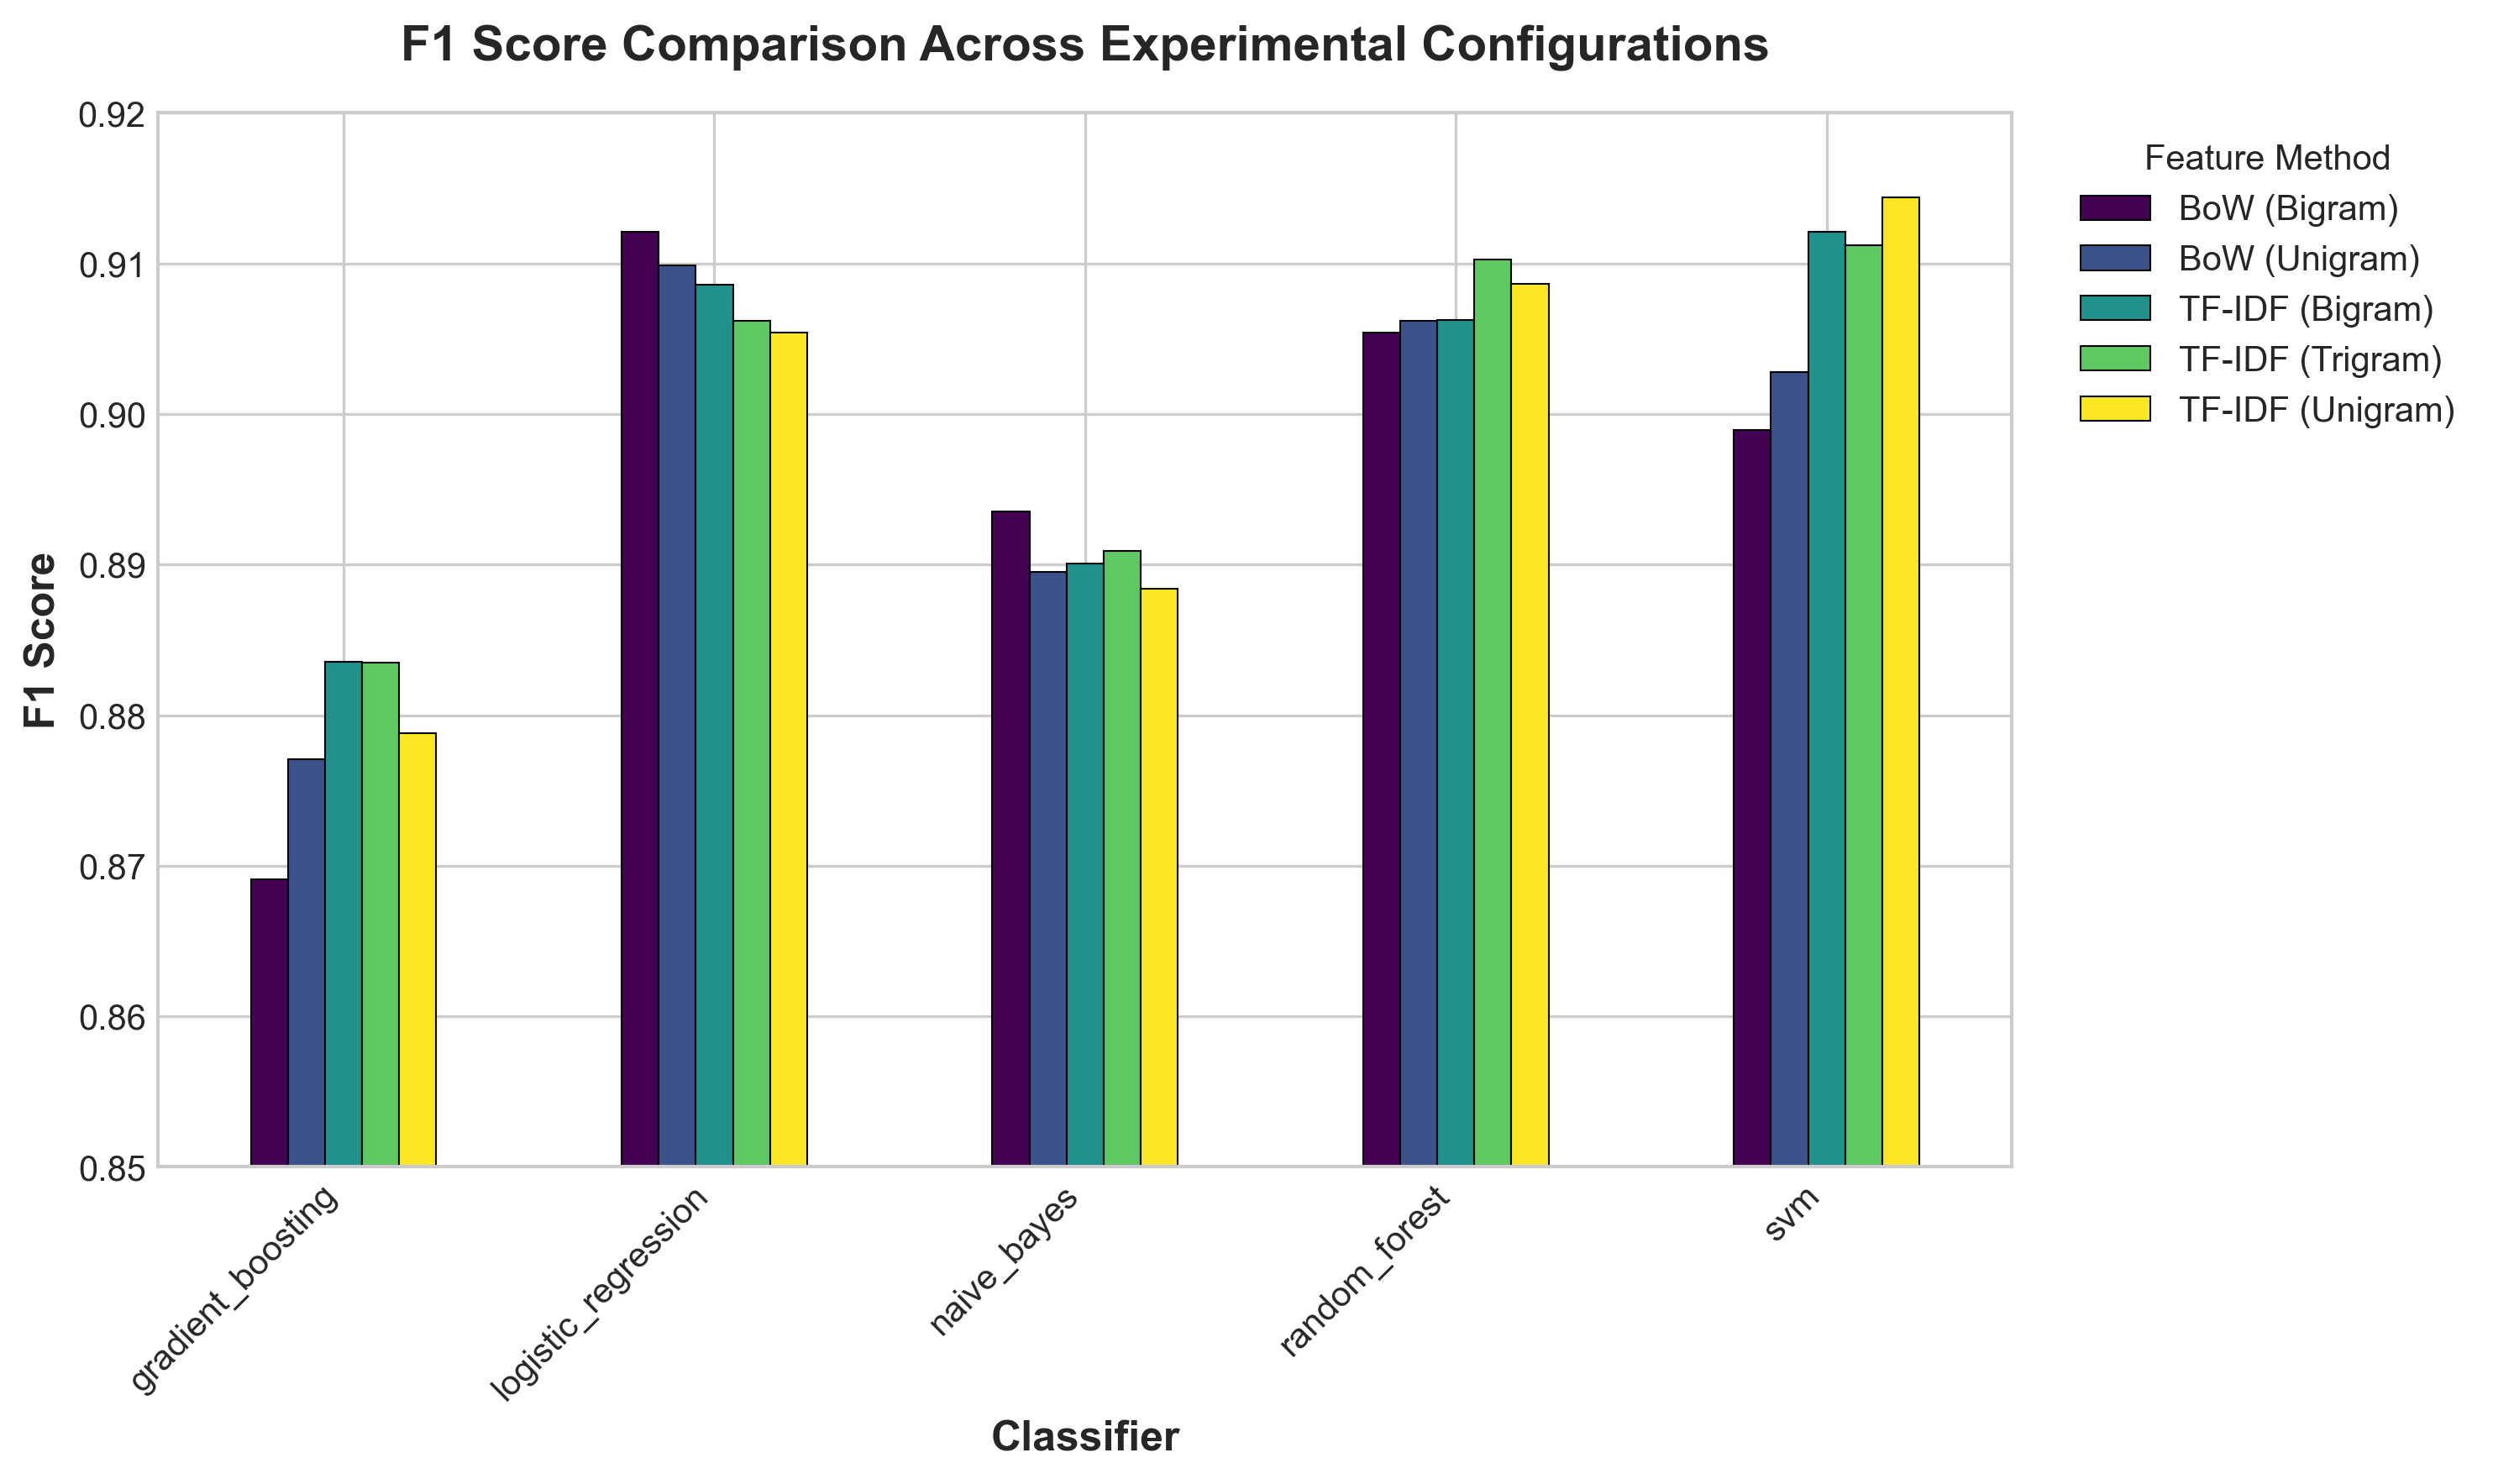
F1 Score Comparison

F1-Score Comparison

Weighted F1-score across all 25 experimental configurations.

Cross-Validation Scores

Cross-Validation Scores

5-fold CV performance with standard deviation error bars showing stability.
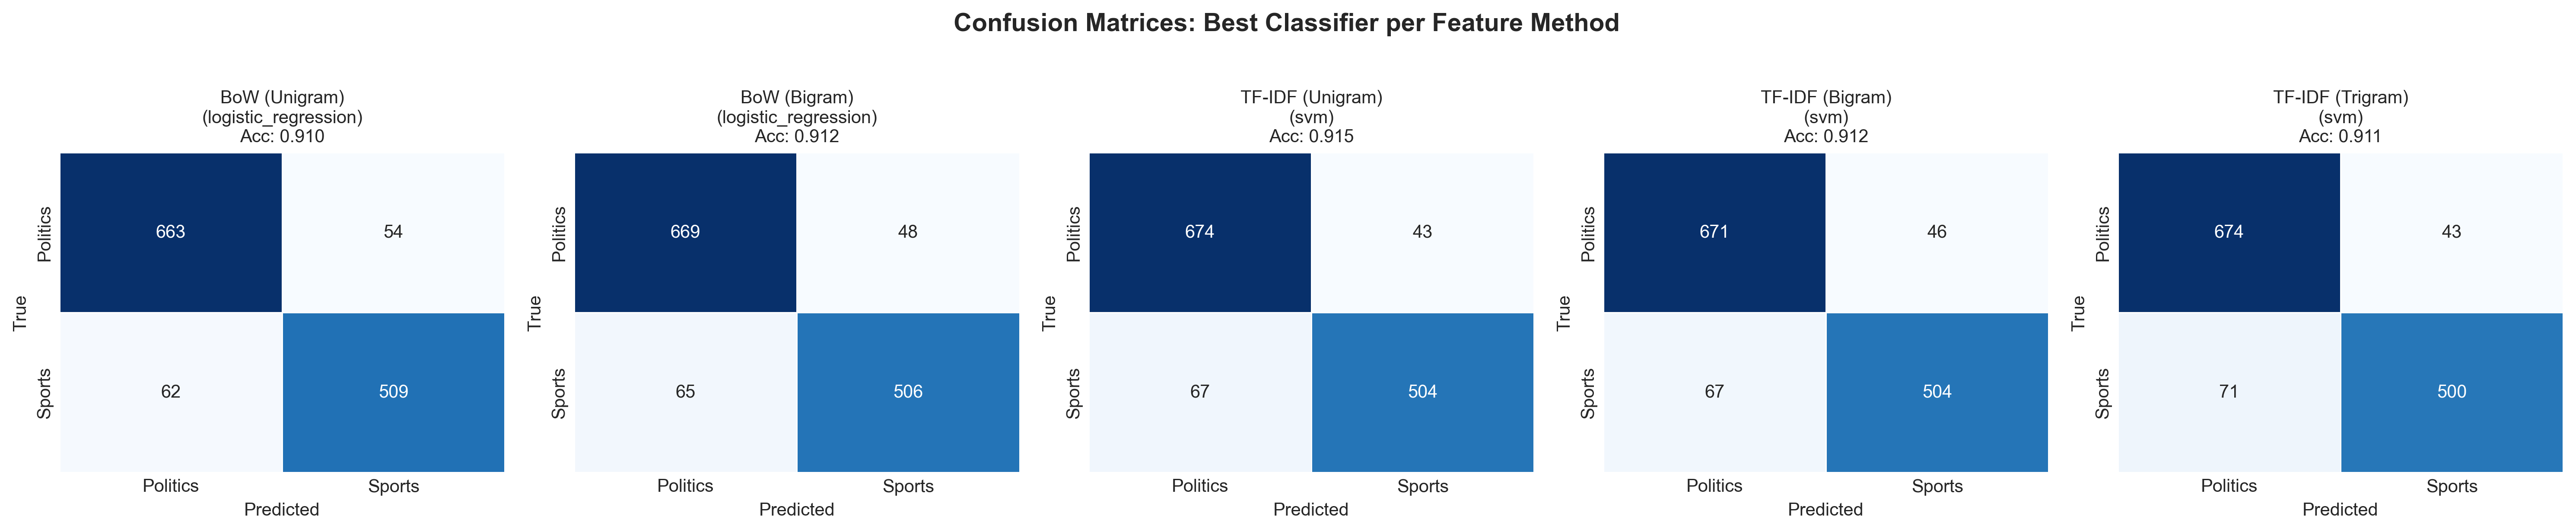
Confusion Matrices

Confusion Matrices

Best classifier per feature method. Note the asymmetry: sports articles misclassified as politics more often than the reverse.
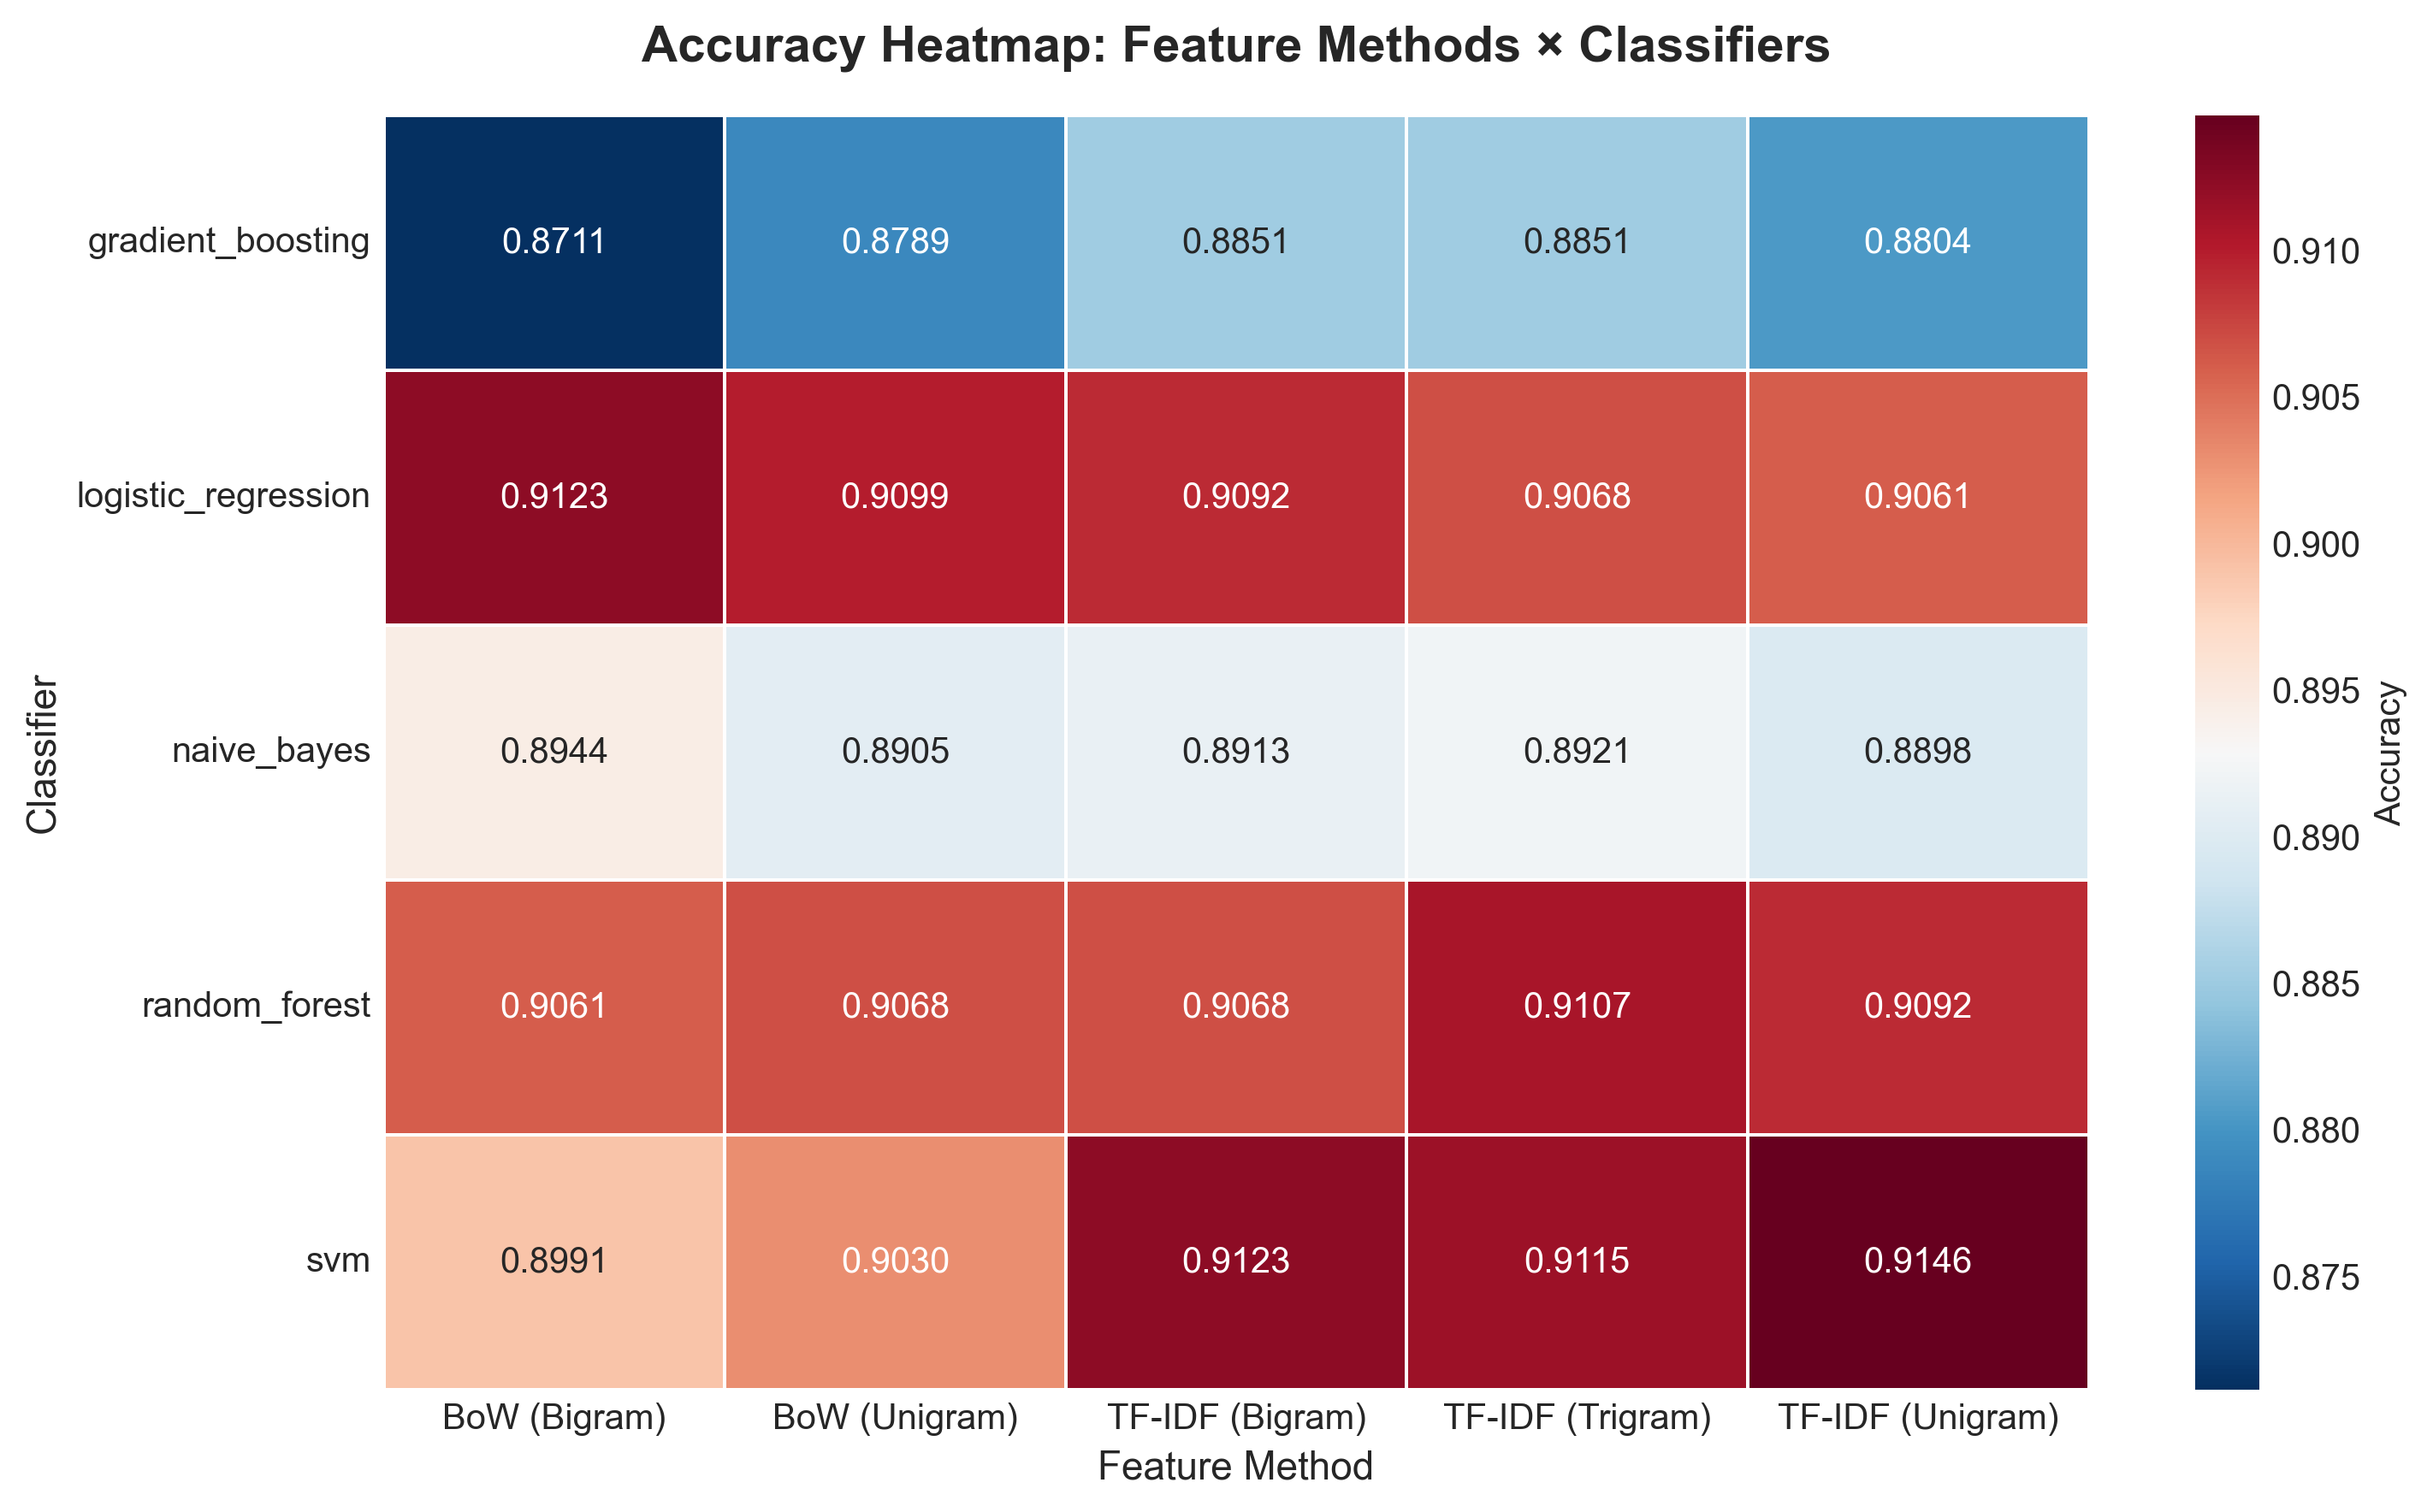
Accuracy Heatmap

Accuracy Heatmap

Feature methods × classifiers grid. Darker red = higher accuracy.
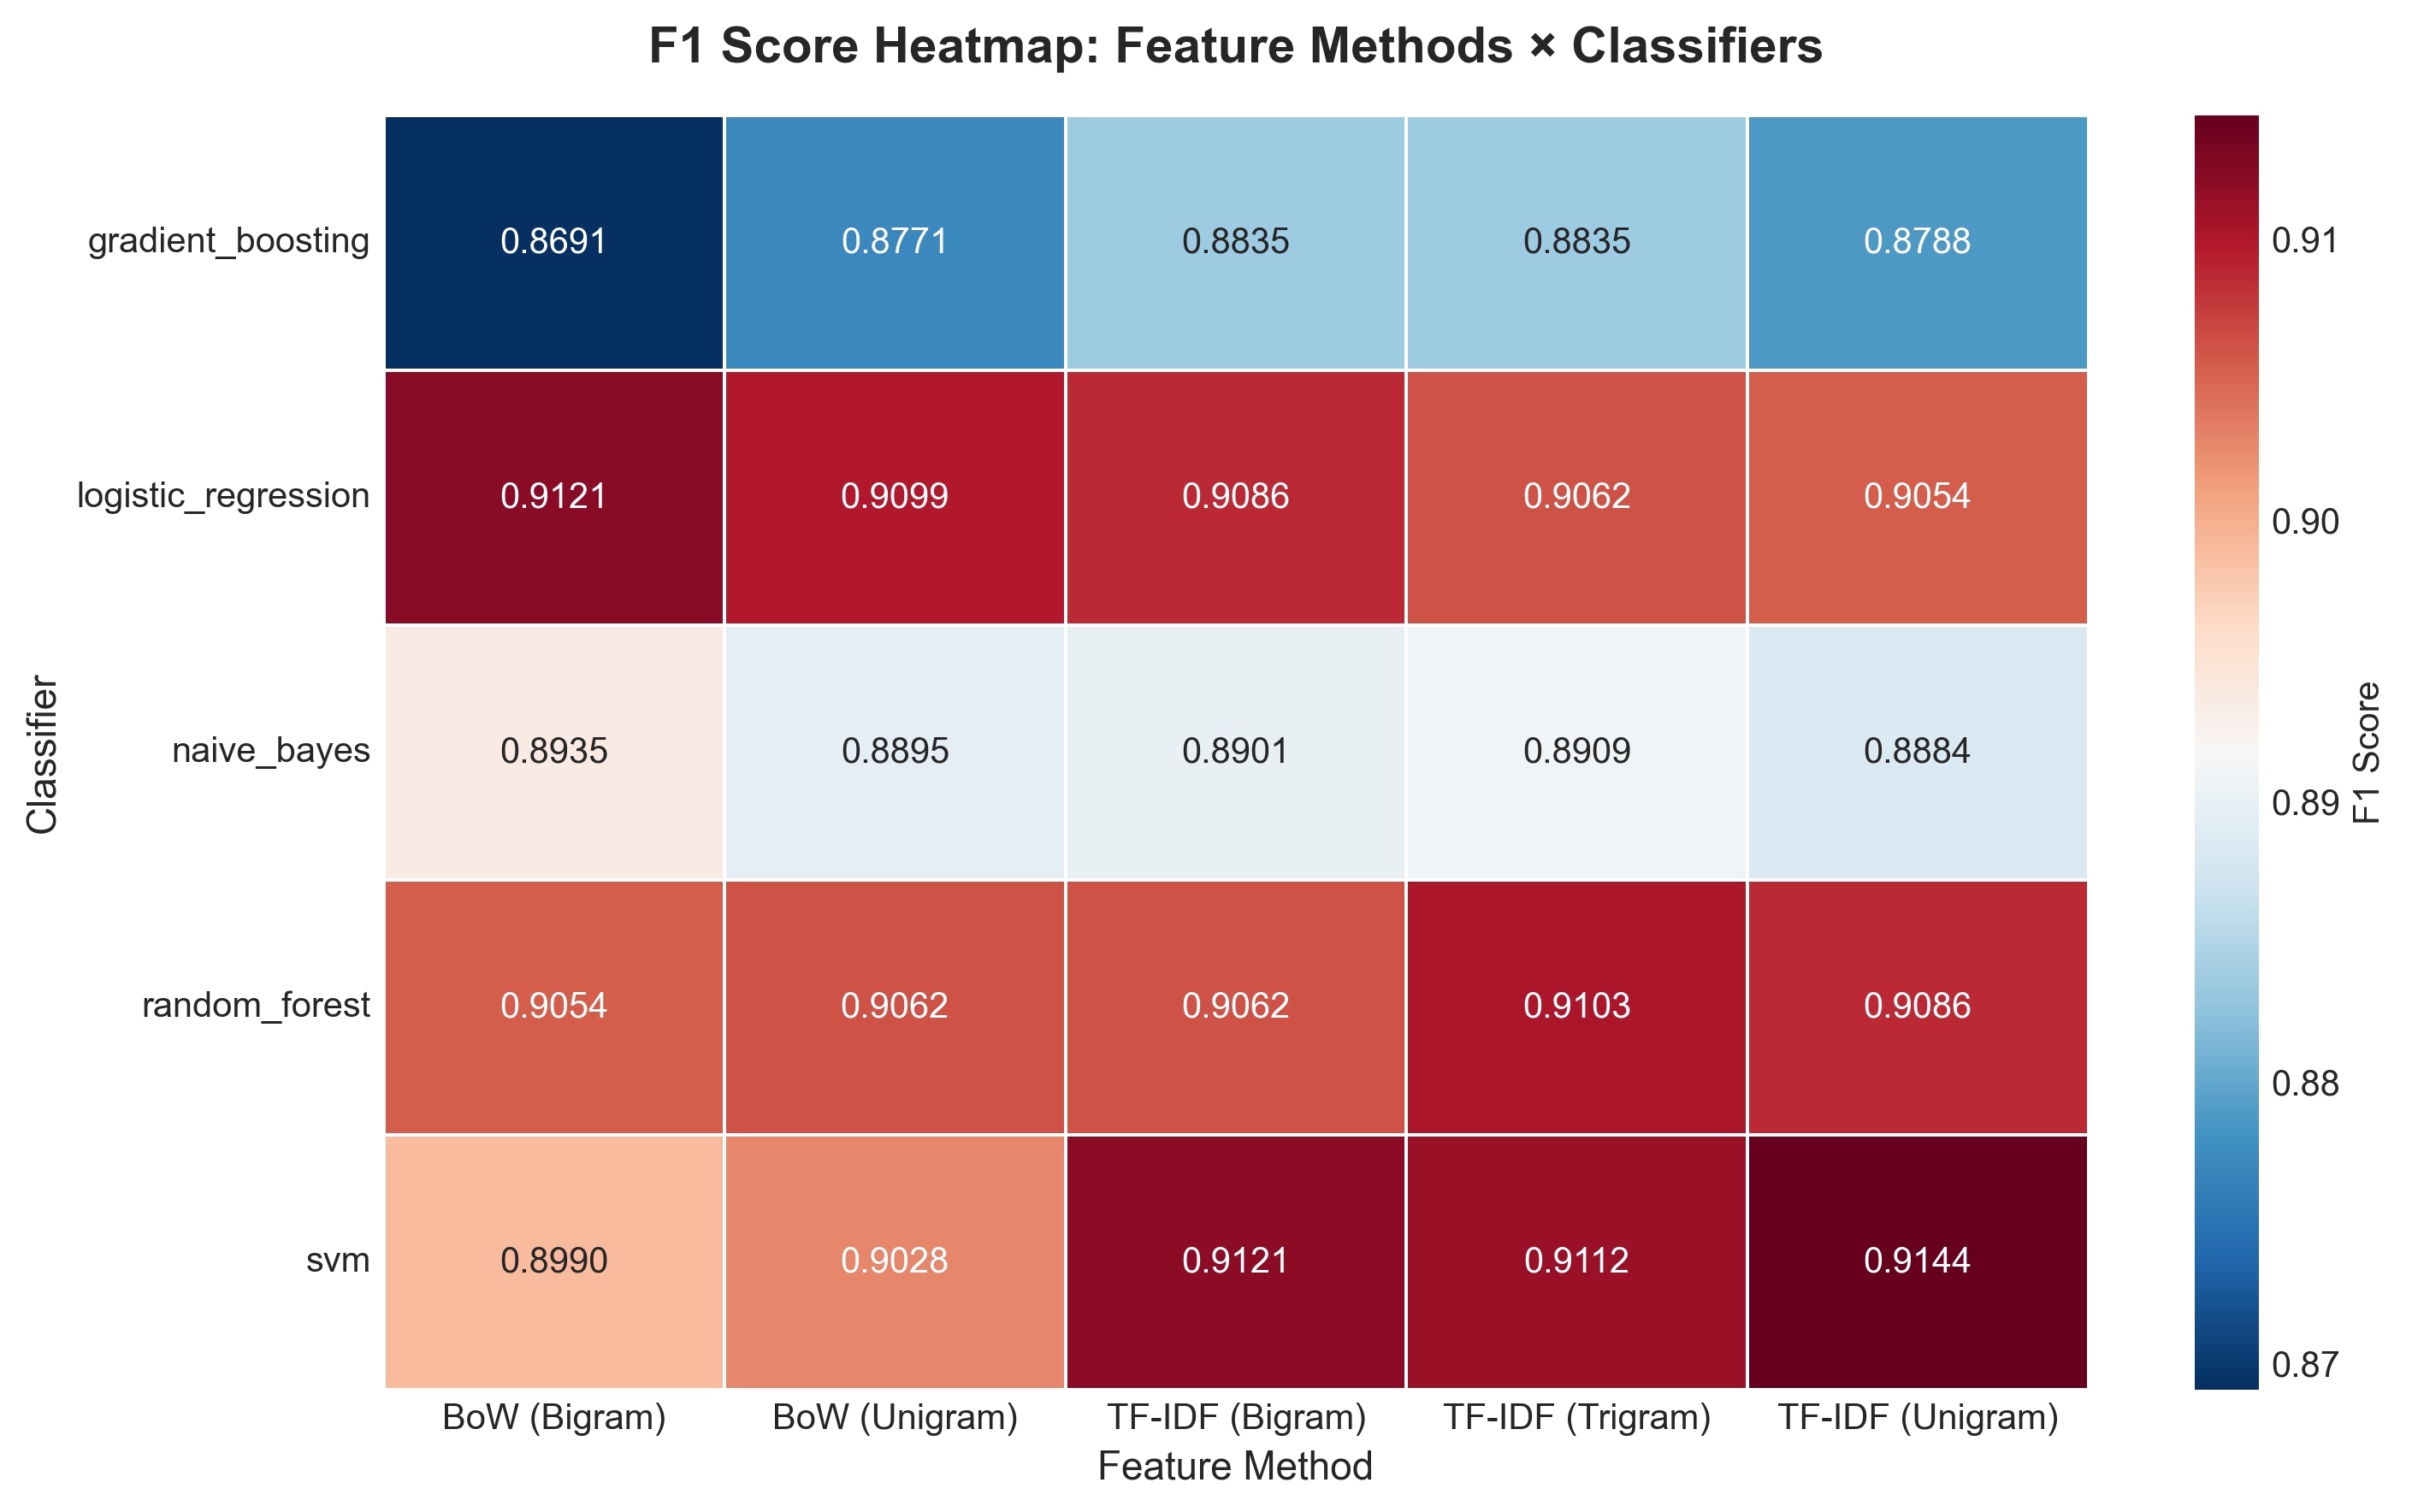
F1 Heatmap

F1-Score Heatmap

Weighted F1 heatmap mirroring the accuracy pattern closely.
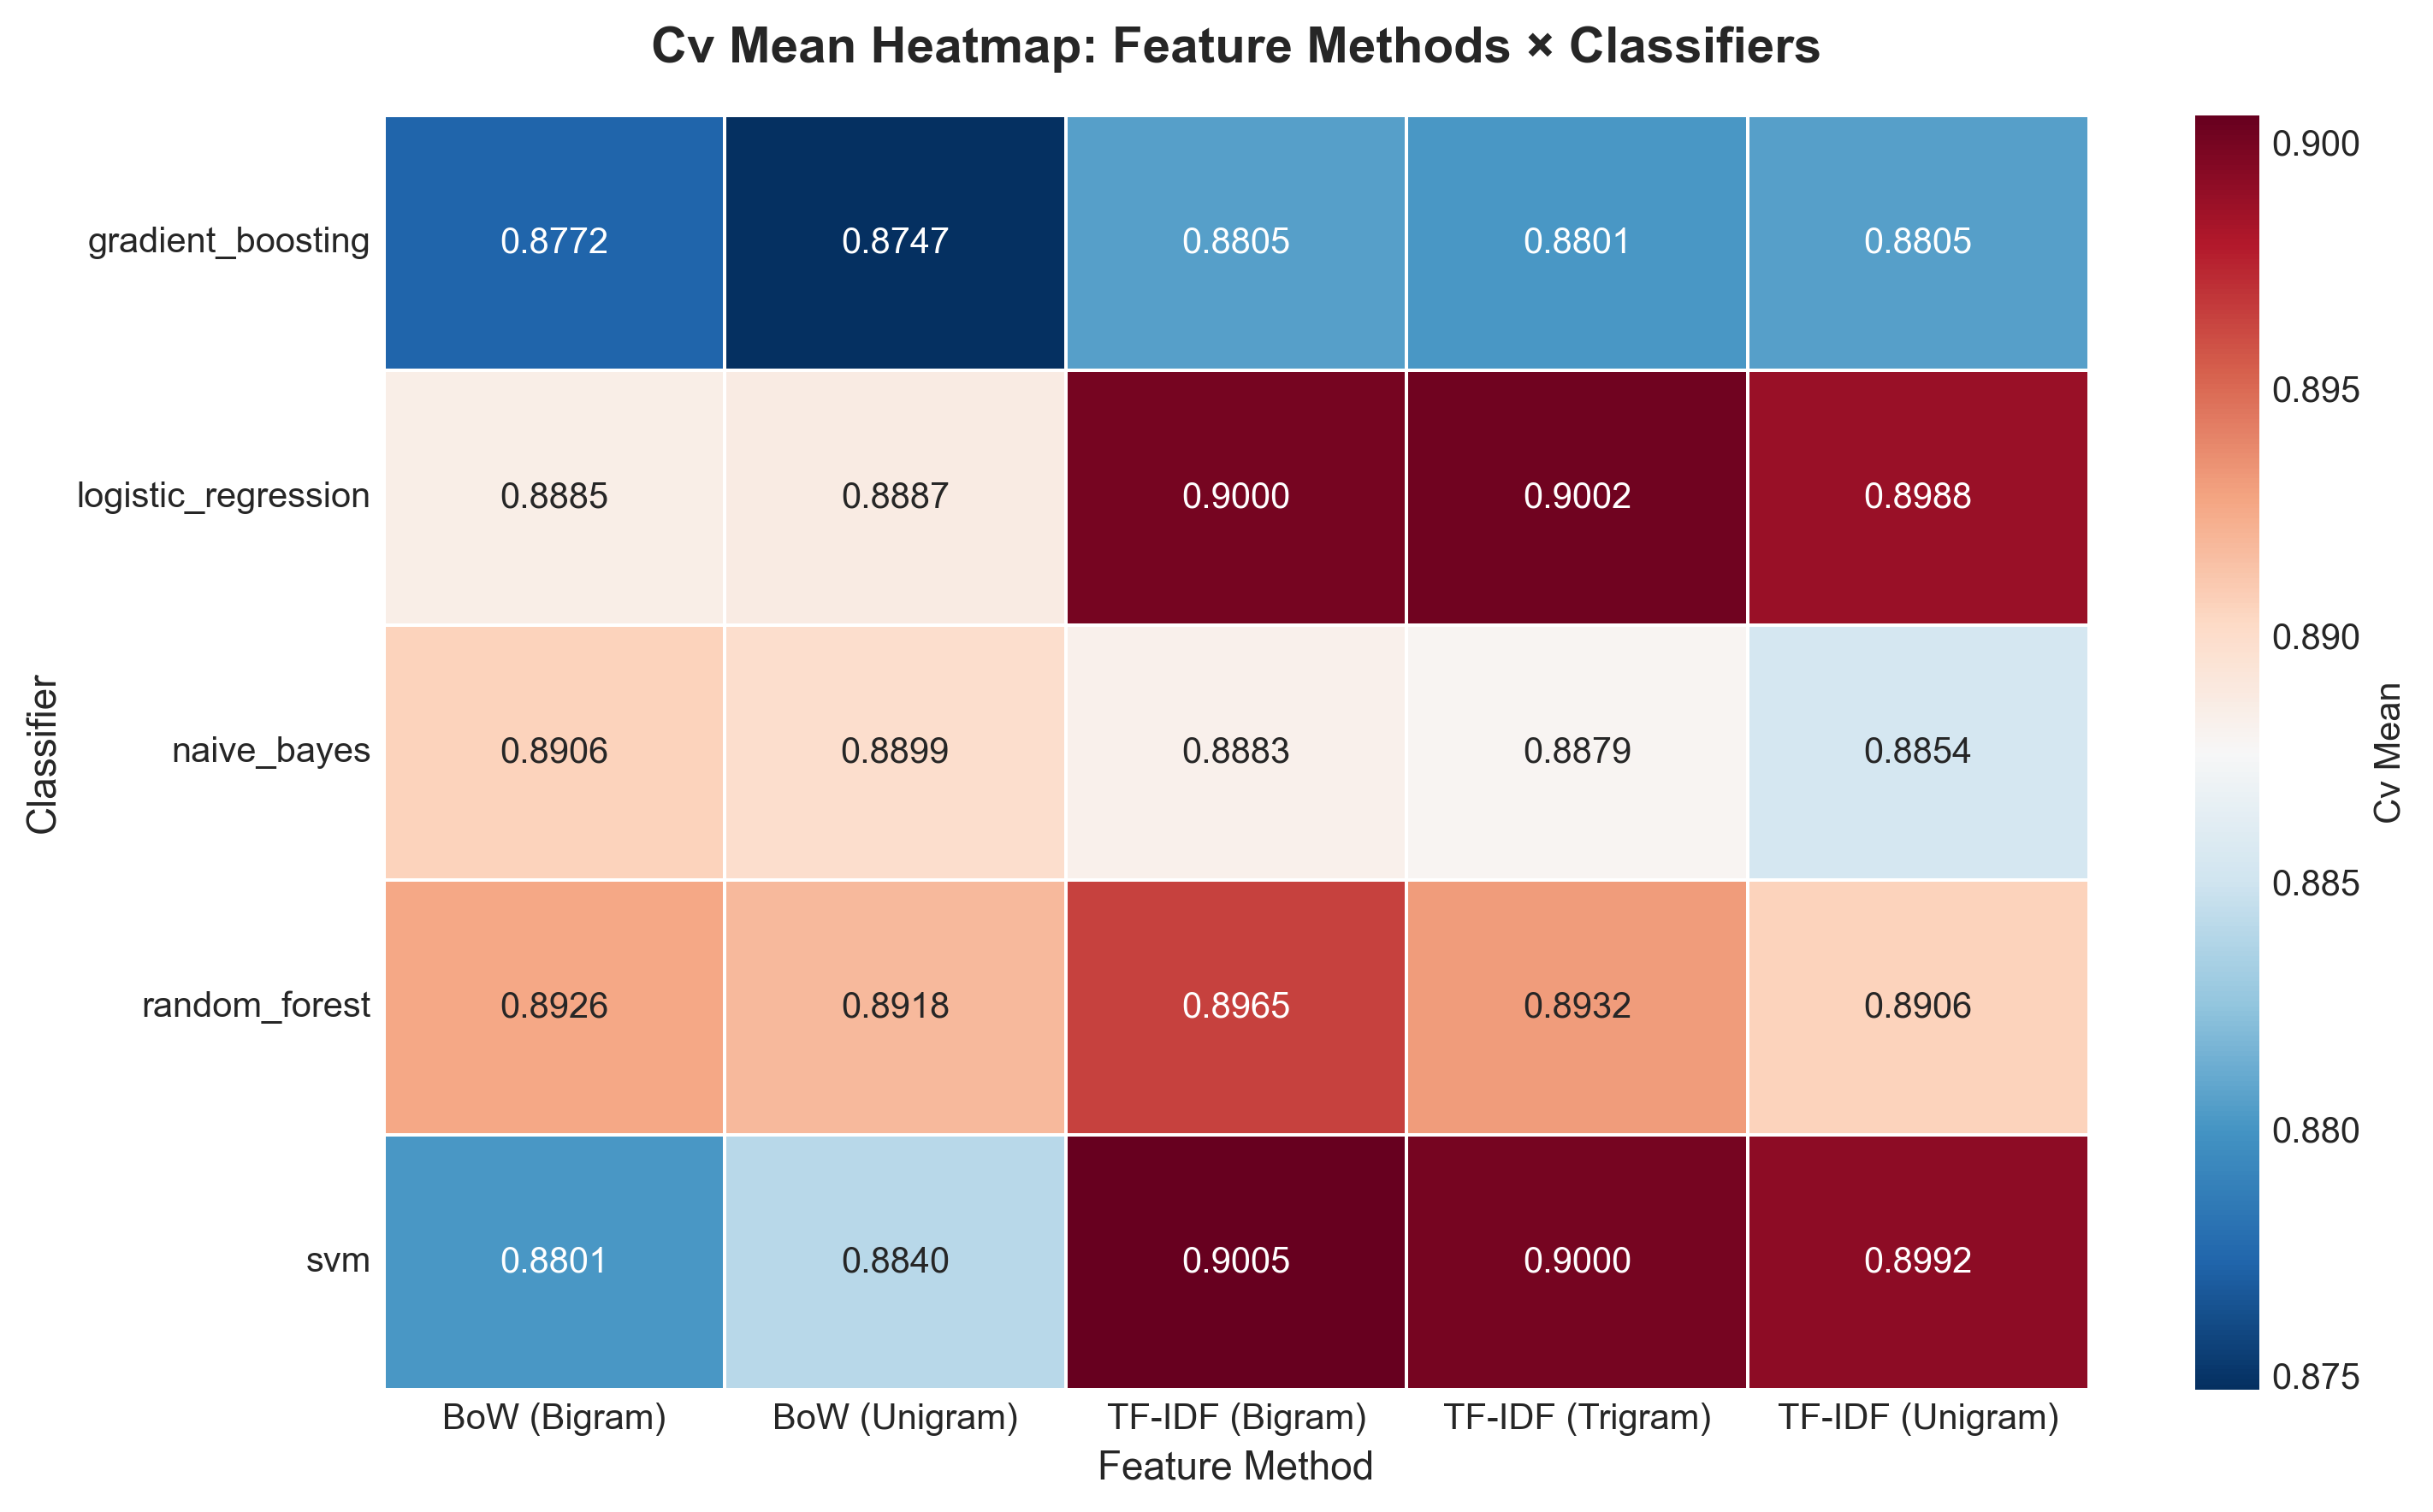
CV Mean Heatmap

CV Mean Heatmap

Cross-validation mean accuracy. TF-IDF features dominate the warm end.
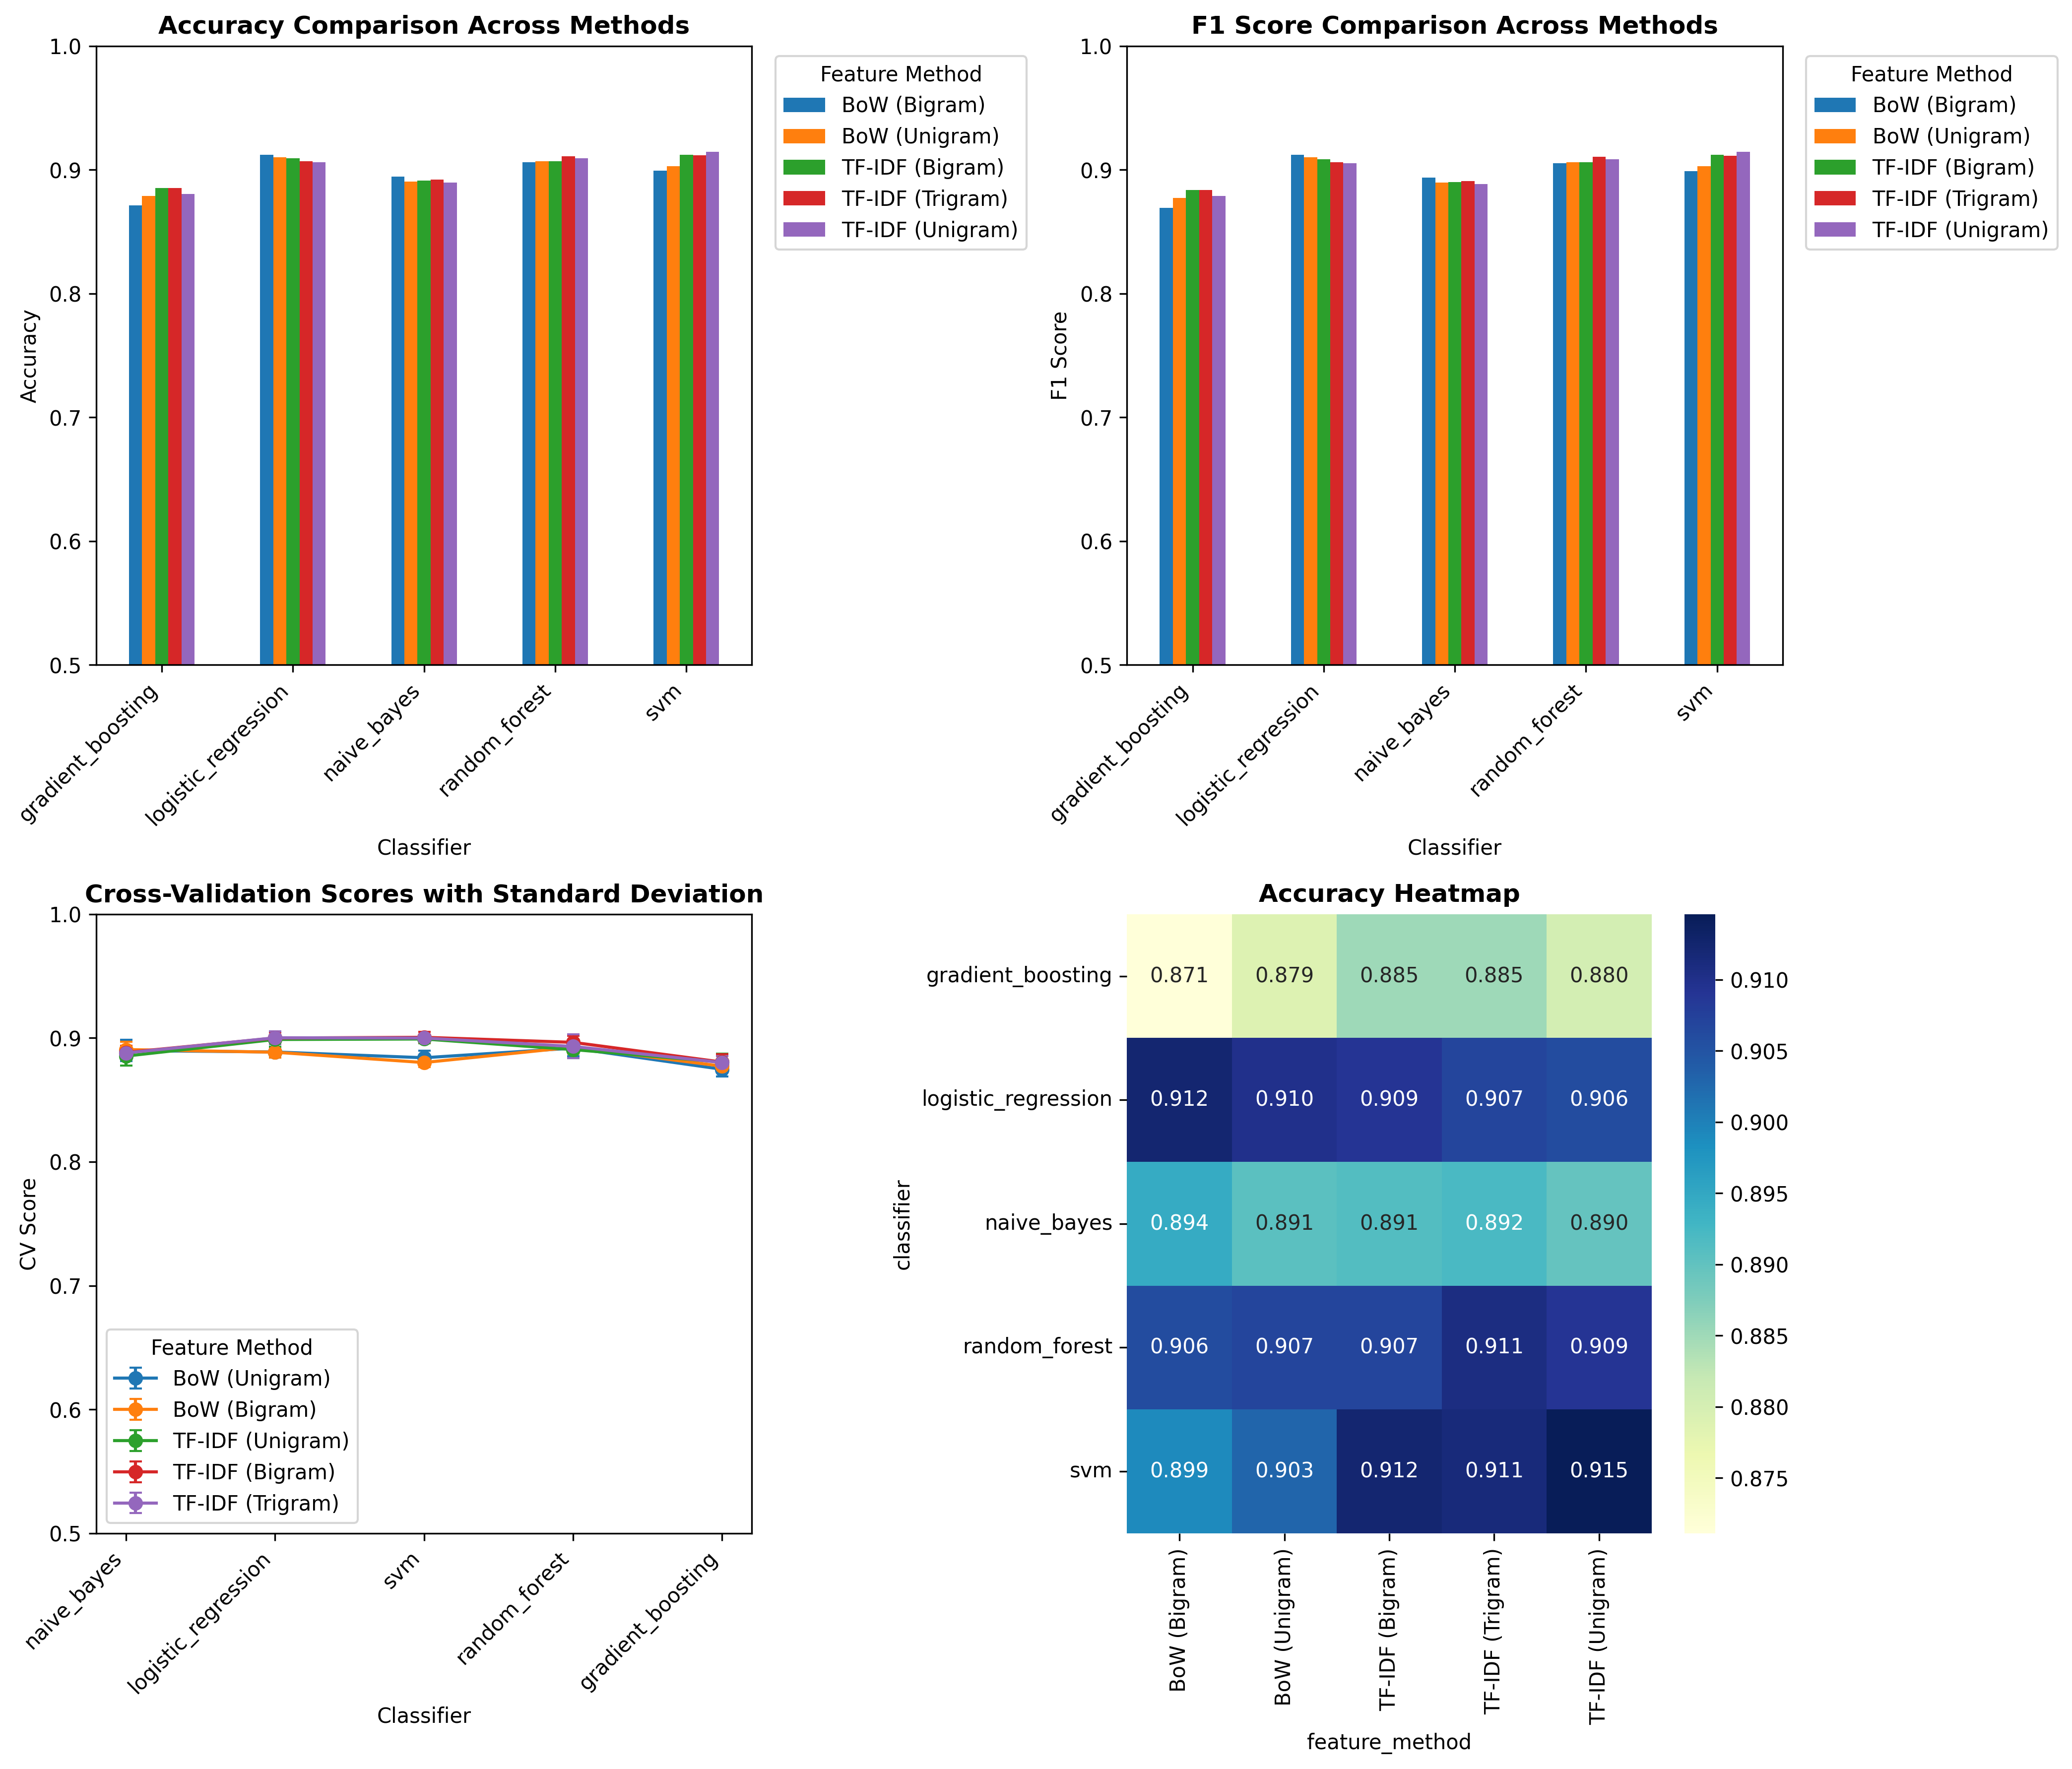
Multi-Panel Comparison

Multi-Panel Summary

Four-panel overview: accuracy, F1, CV scores, and heatmap in one figure.
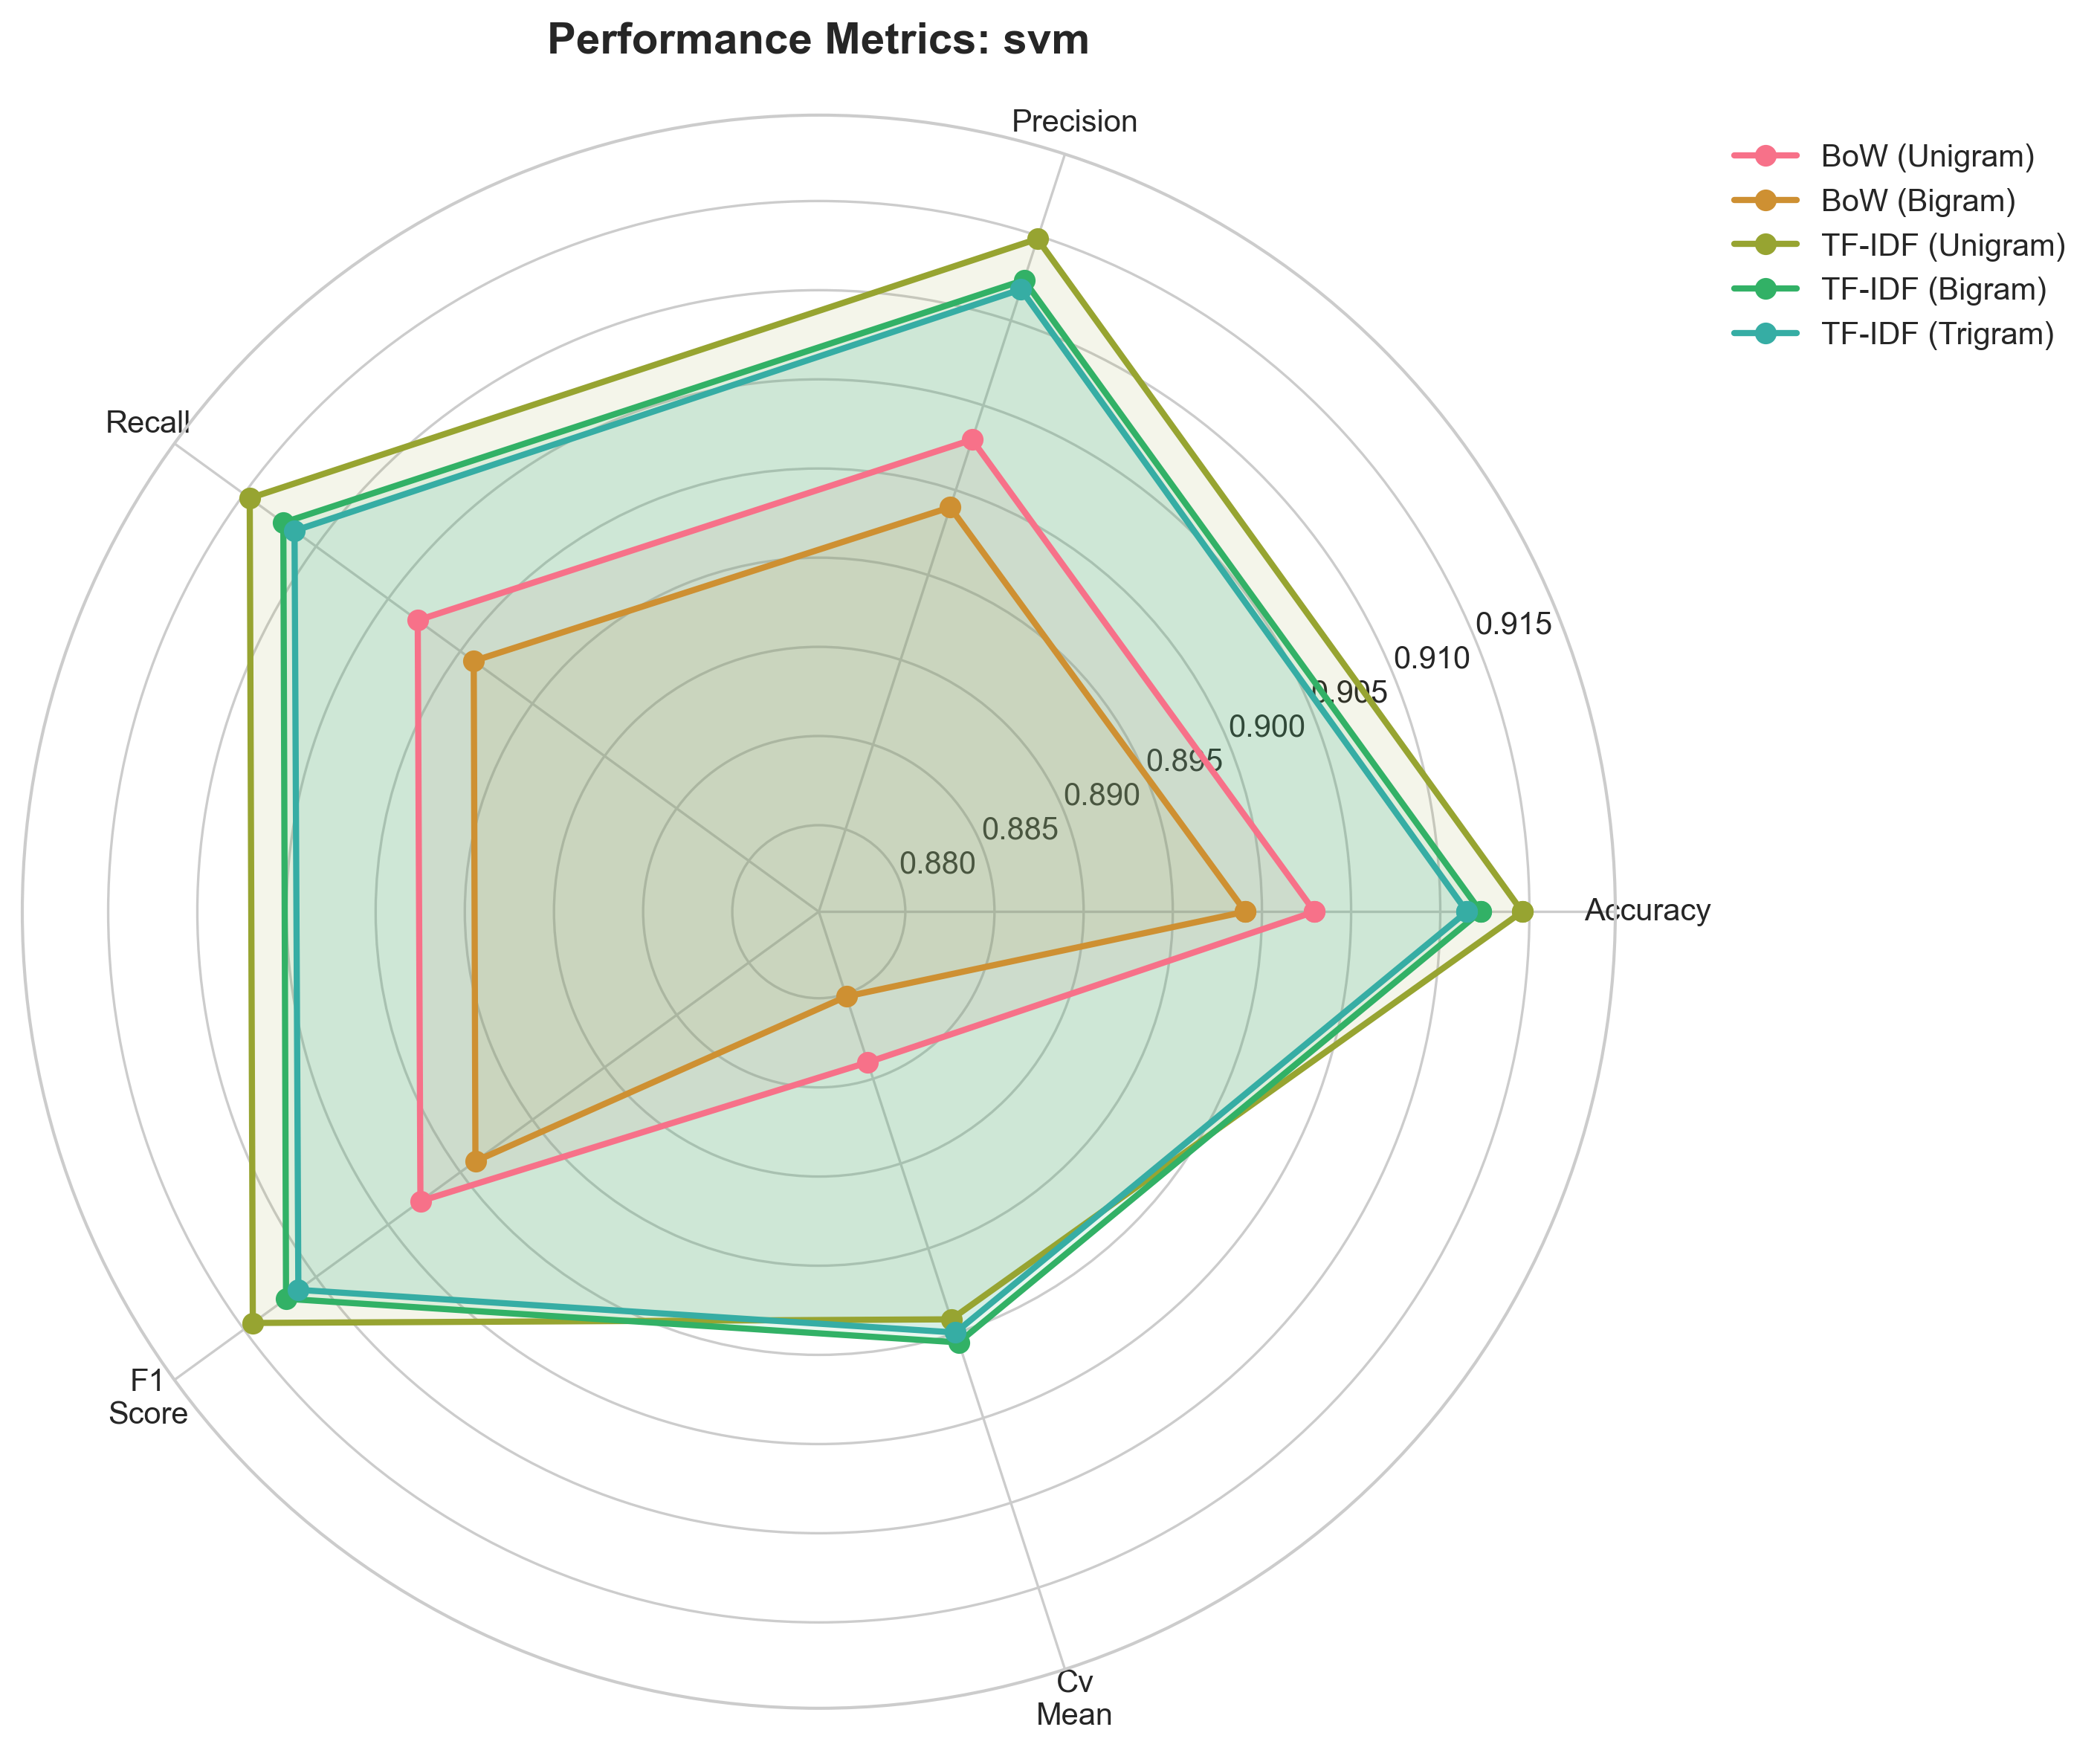
Radar Chart: SVM

Radar Chart — SVM

Multi-metric profile. TF-IDF features push the polygon outward on all axes.

Radar Chart: Logistic Regression

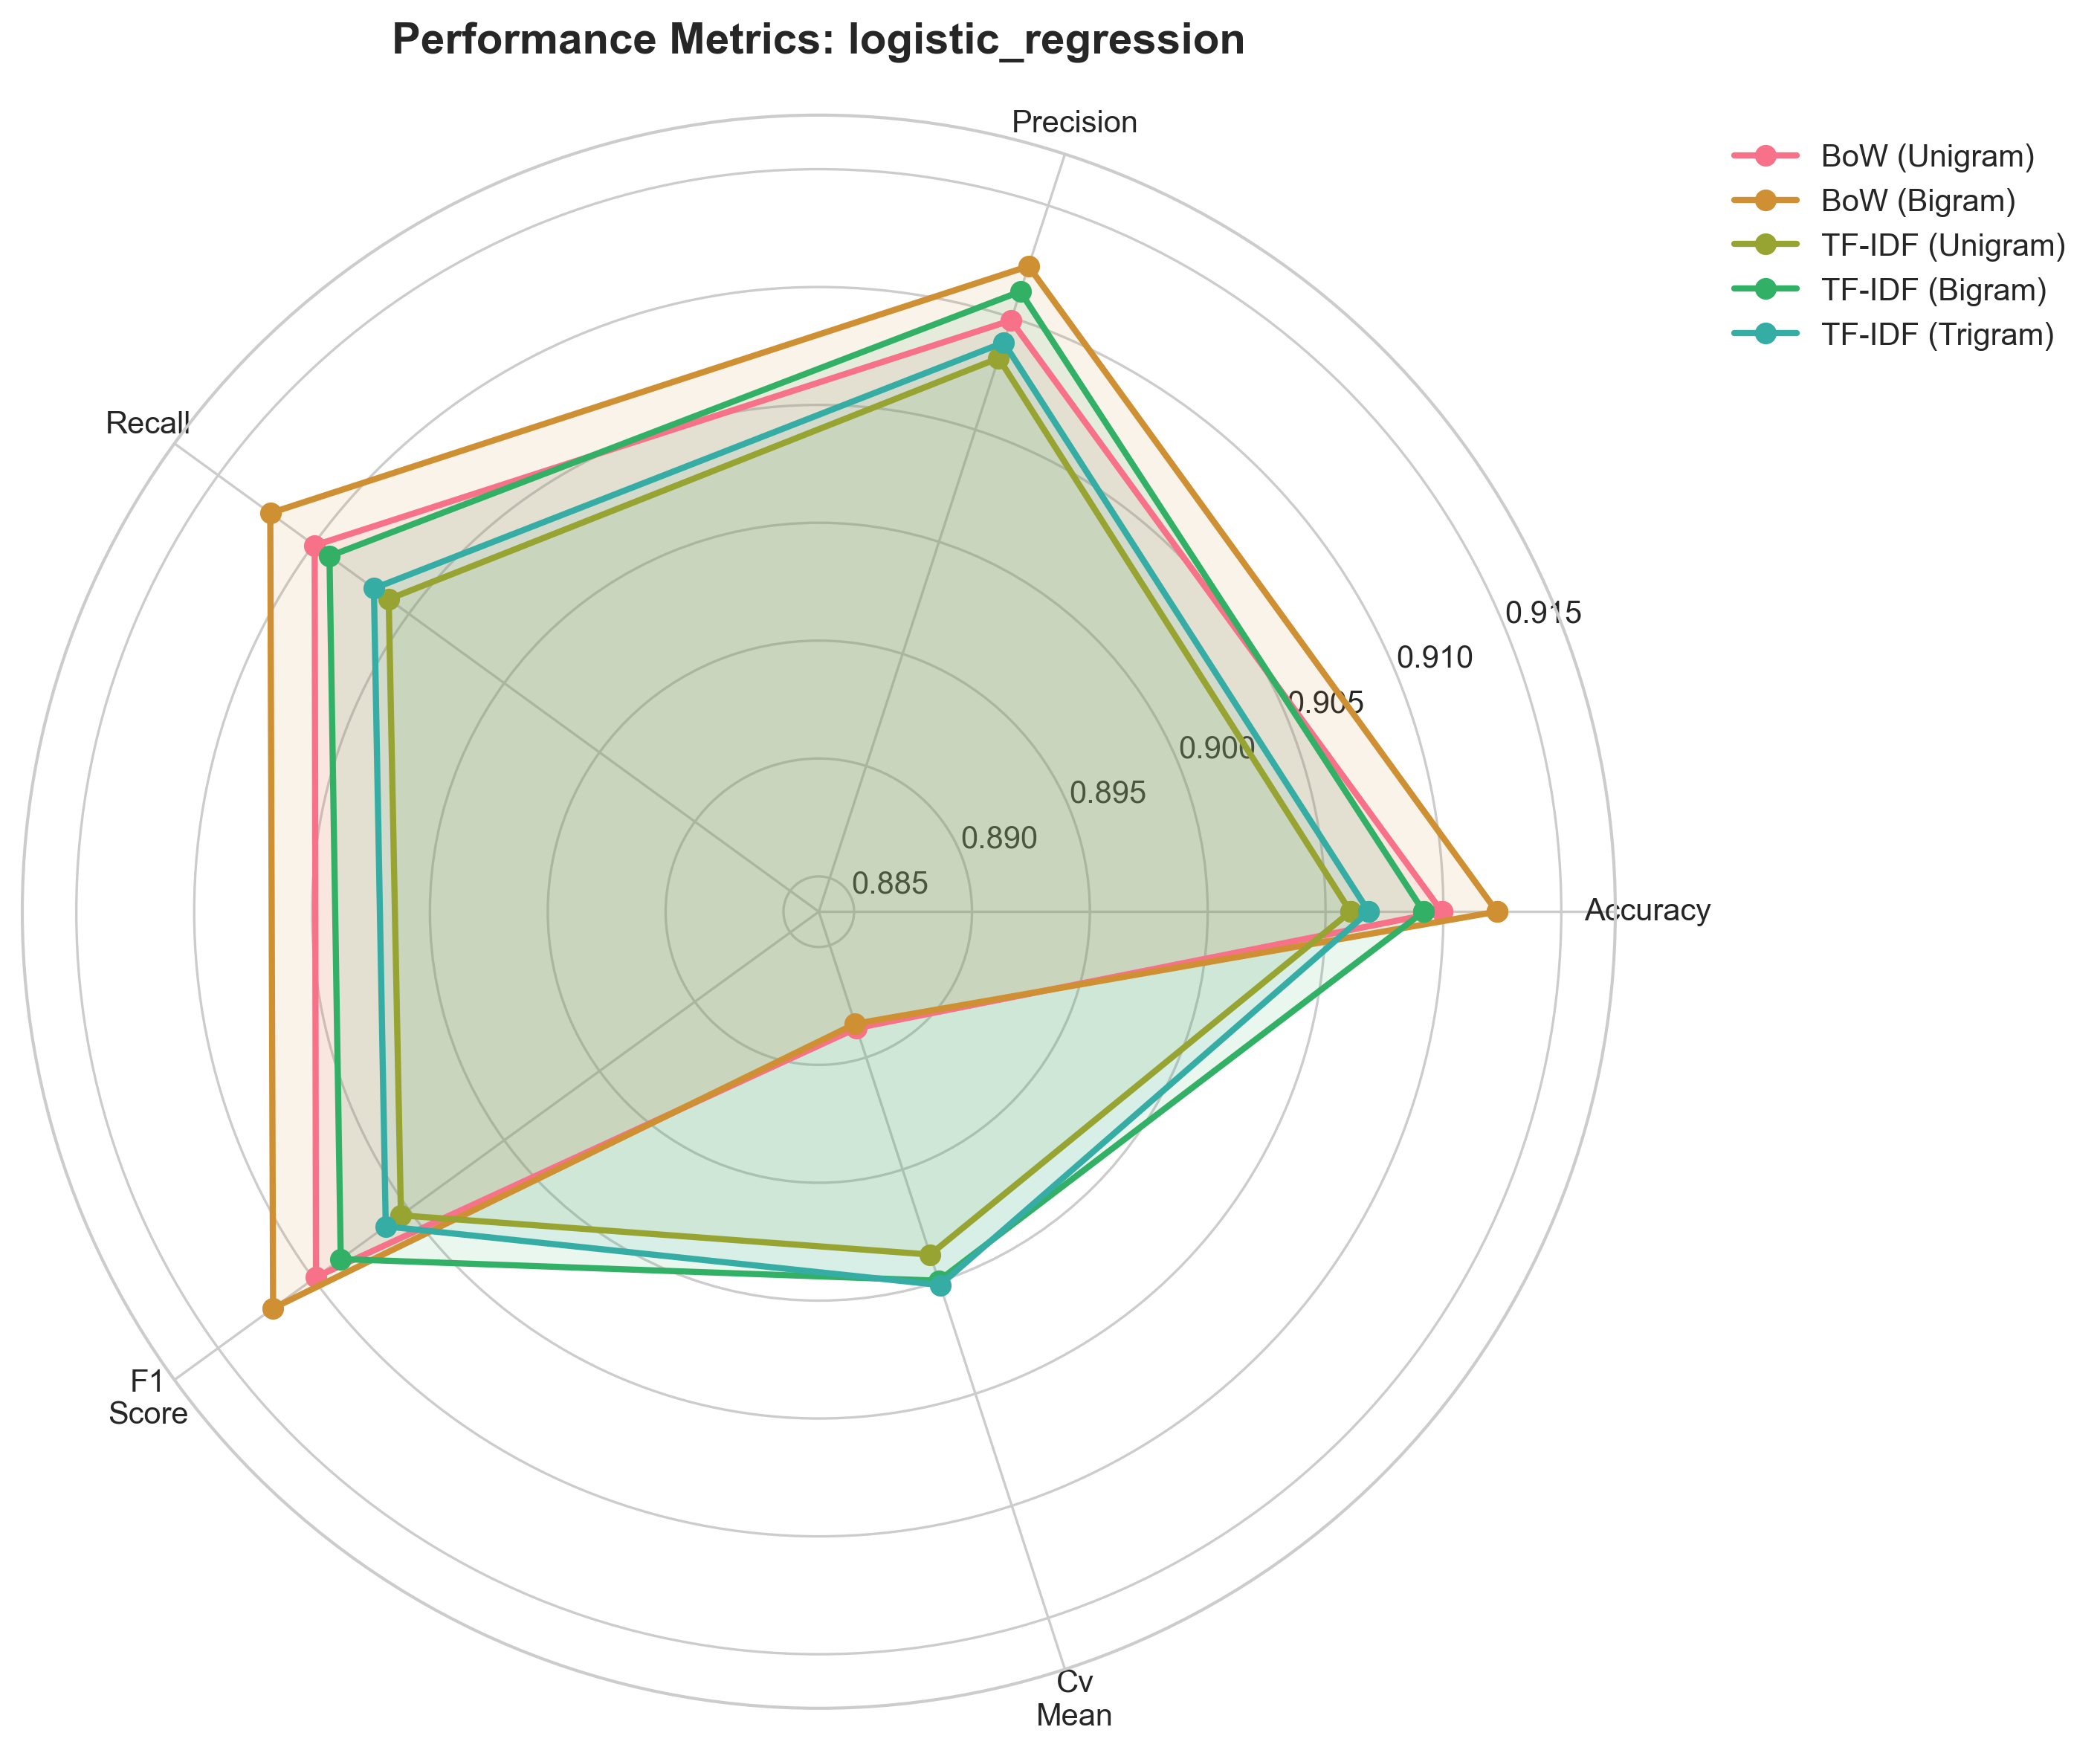
Radar Chart — Logistic Regression

BoW (Bigram) dominates here, unlike SVM where TF-IDF leads.

Radar Chart: Naive Bayes

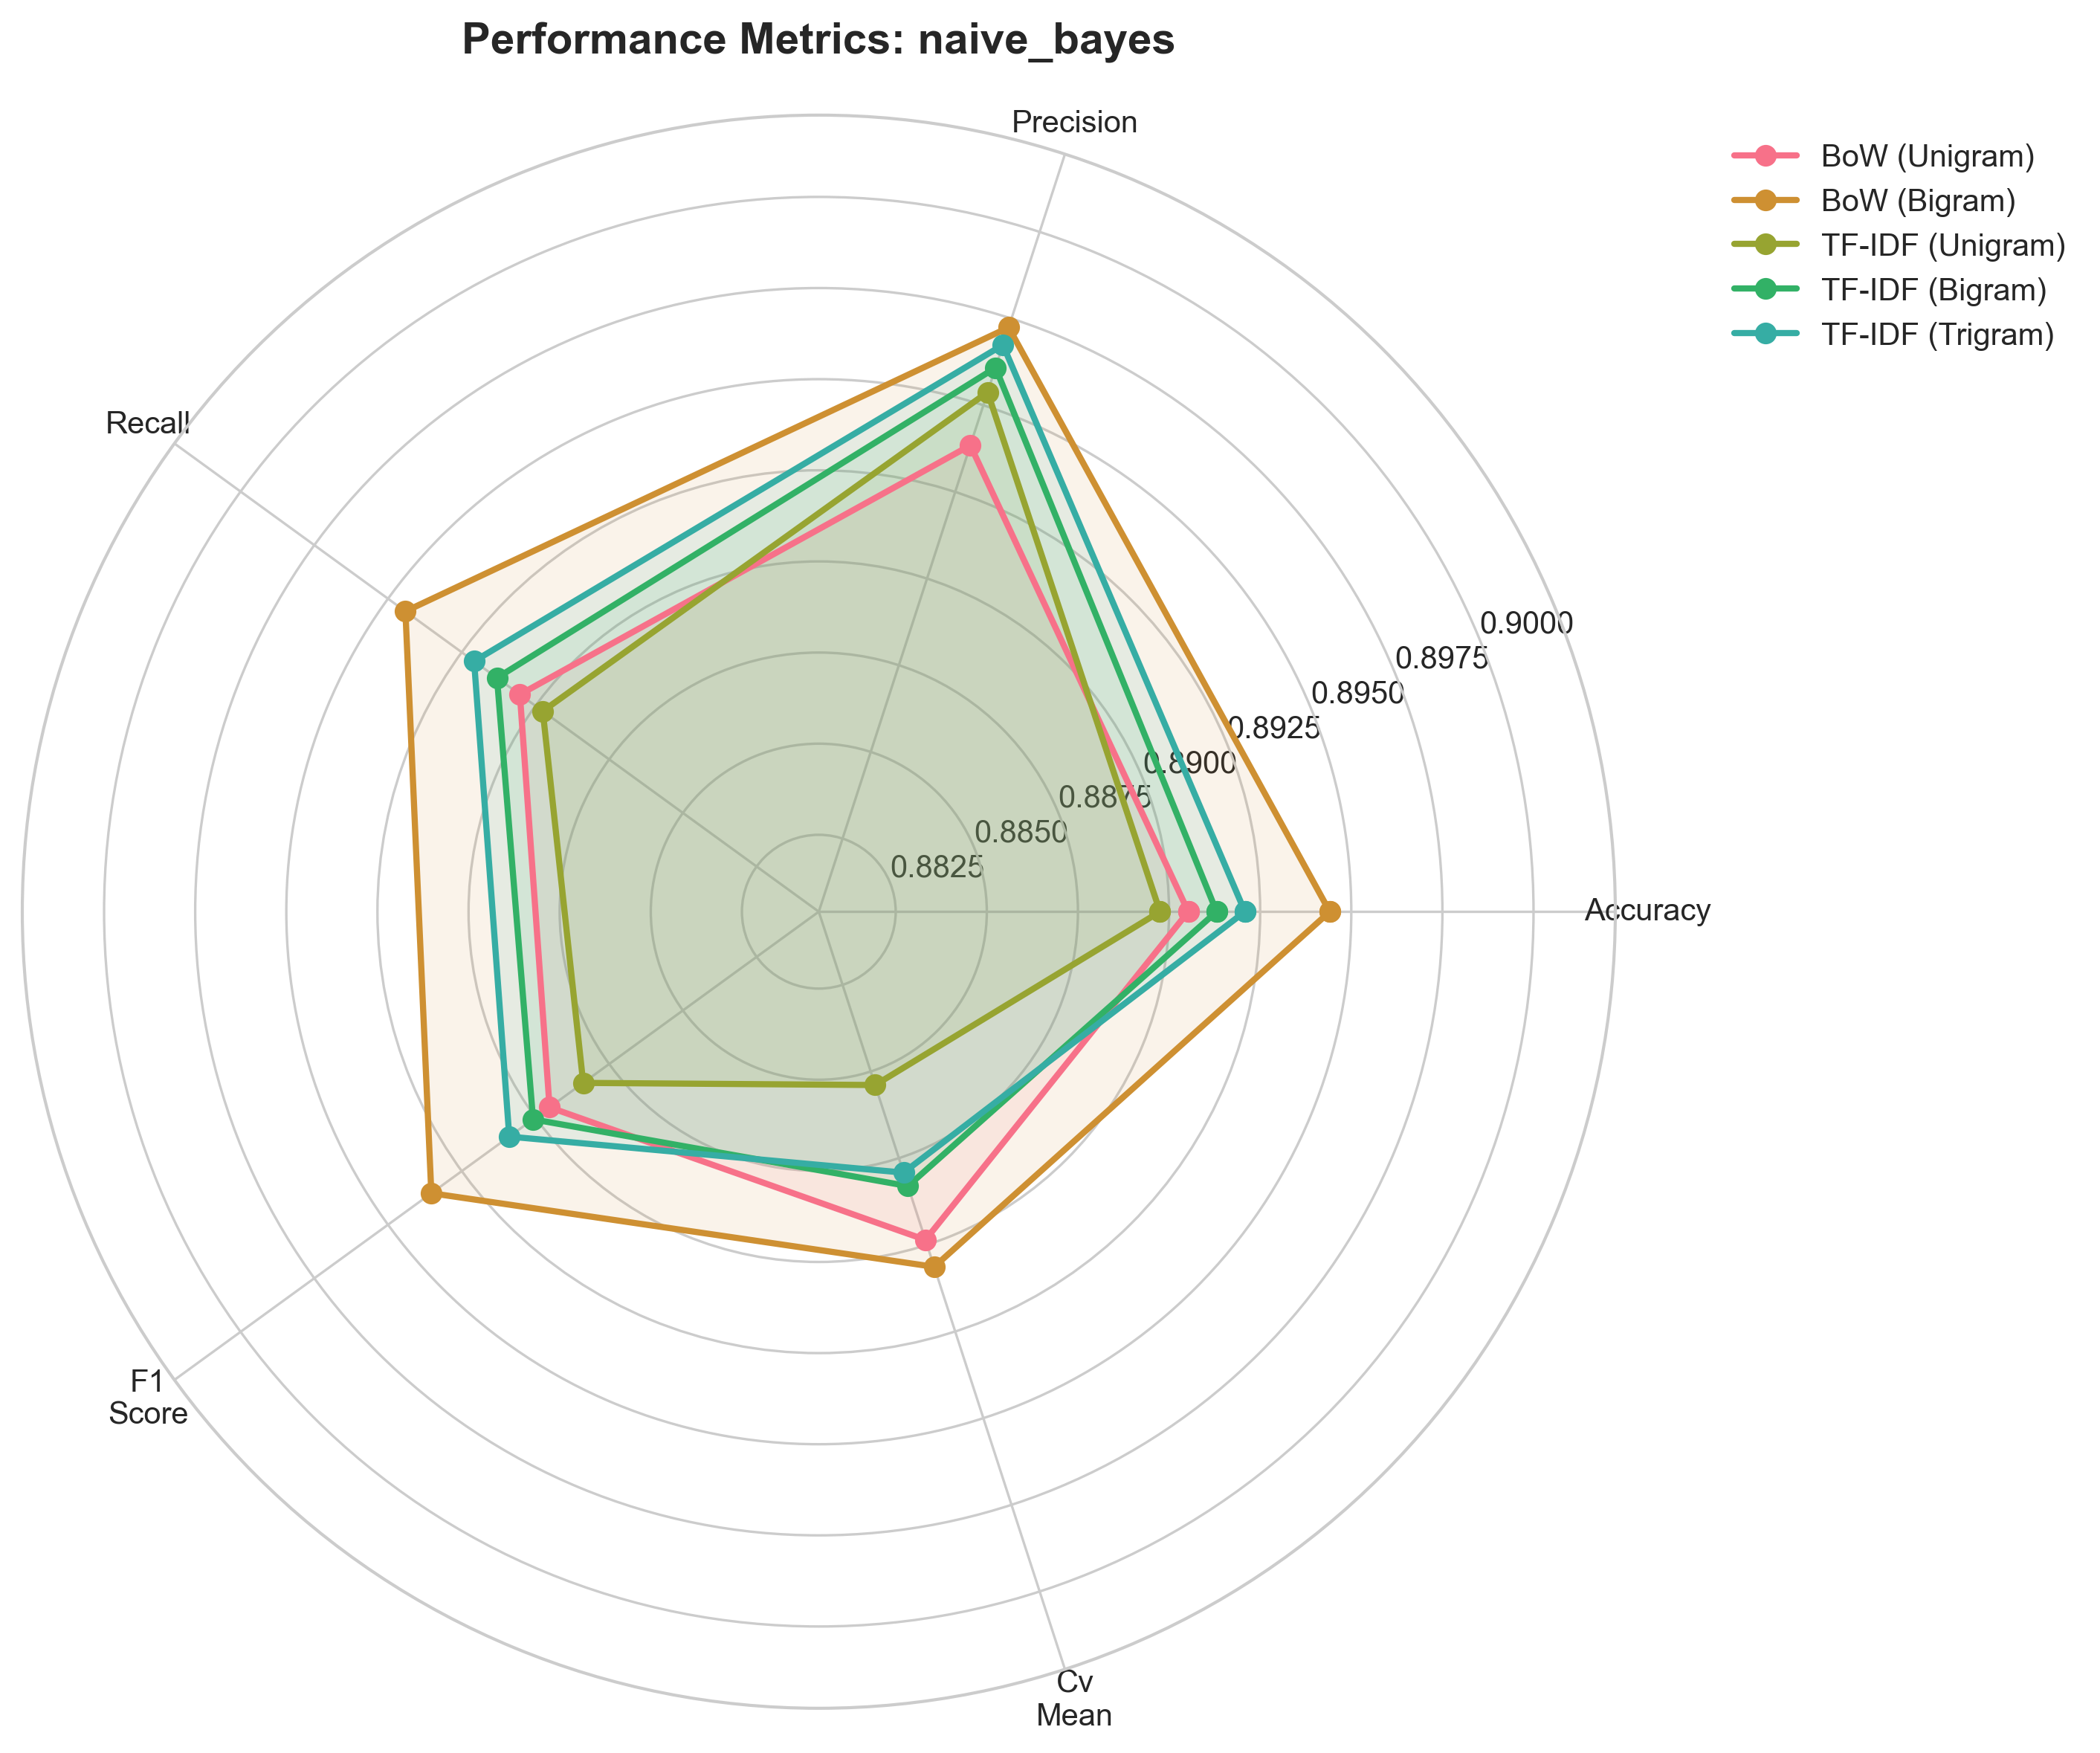
Radar Chart — Naive Bayes

Most compact polygon among the three, reflecting lower overall scores.

Key Findings

01

TF-IDF Consistently Outperforms Bag of Words

Across every classifier, TF-IDF representations yielded higher accuracy than raw count vectors. The SVM saw the most dramatic gain: 89.91% with BoW (Bigram) jumped to 91.46% with TF-IDF (Unigram)—a 1.55-point lift from weighting alone. The inverse document frequency term down-weights ubiquitous tokens and amplifies rare but discriminative ones.

02

Linear Models Dominate

SVM and Logistic Regression consistently claimed the top positions regardless of feature method. This is expected: text feature spaces are high-dimensional (5,000 features), sparse, and approximately linearly separable for well-separated topic categories. The ensemble methods—built for low-dimensional dense features—could not leverage their non-linear capacity effectively.

03

N-gram Expansion Hits Diminishing Returns

For SVM, TF-IDF (Unigram) actually outperformed both bigram and trigram variants. The max_features=5000 cap forces a trade-off: as the n-gram range grows, the 5,000 slots are spread across unigrams, bigrams, and trigrams rather than concentrating on the strongest unigrams. Bigger n-gram ranges need proportionally larger feature budgets.

04

Gradient Boosting Struggles on Text

Despite dominating tabular data benchmarks, Gradient Boosting finished last in every feature configuration, trailing the leader by 2–4 percentage points. The greedy, sequential tree construction struggles with the extreme sparsity of text vectorizations—most splits involve features that are zero for the vast majority of documents.

05

Confusion Matrix Asymmetry

All models misclassify more sports articles as politics than the reverse. Under the best configuration, 67/571 sport articles were mislabeled (11.7% error) versus 43/717 politics articles (6.0%). Political coverage occasionally discusses sporting events in a policy context (stadium funding, doping regulation), creating boundary cases that blur the decision surface.

Try the Classifier

Type any news headline or article excerpt, pick a model, and see the prediction in real time — powered by Hugging Face Spaces.

Try an example:
🏛️
Politics
98.2% confidence
Politics 🏛️
0%
Sports ⚽
0%
SVM + TF-IDF (Unigram) · 91.46% test accuracy
⚠️ Something went wrong. The model might be loading — please try again in a few seconds.